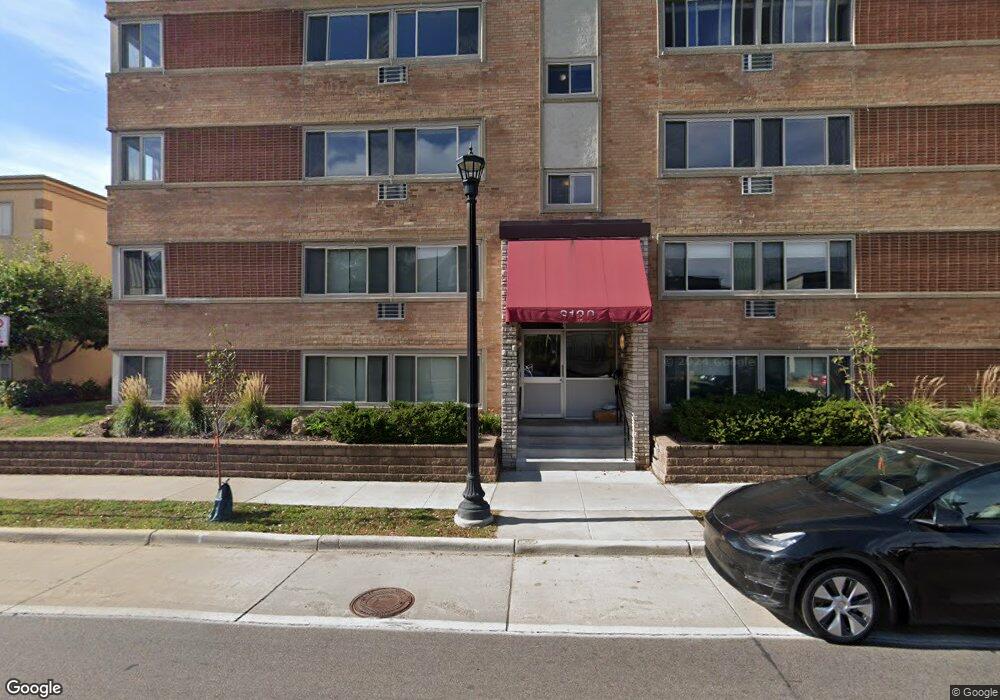
3120 Hennepin Ave Unit 307 Minneapolis, MN 55408
East BDE Maka Ska NeighborhoodEstimated Value: $112,000 - $139,000
1
Bed
1
Bath
618
Sq Ft
$198/Sq Ft
Est. Value
About This Home
This home is located at 3120 Hennepin Ave Unit 307, Minneapolis, MN 55408 and is currently estimated at $122,492, approximately $198 per square foot. 3120 Hennepin Ave Unit 307 is a home located in Hennepin County with nearby schools including Kenwood Elementary School, Anwatin Middle School, and North Community High School.
Ownership History
Date
Name
Owned For
Owner Type
Purchase Details
Closed on
Dec 21, 2021
Sold by
Uppal Group Llc
Bought by
Lien Alexandra and Lien Sebastian
Current Estimated Value
Purchase Details
Closed on
Feb 24, 2016
Sold by
Bruns Jennifer Jennifer
Home Financials for this Owner
Home Financials are based on the most recent Mortgage that was taken out on this home.
Original Mortgage
$80,000
Interest Rate
3.81%
Mortgage Type
Commercial
Purchase Details
Closed on
Dec 23, 2015
Sold by
Bruns Jennifer A
Bought by
Loandepotcom Llc
Purchase Details
Closed on
Jan 30, 2009
Sold by
3120 Hennepin Llc
Bought by
Bruns Jennifer A
Create a Home Valuation Report for This Property
The Home Valuation Report is an in-depth analysis detailing your home's value as well as a comparison with similar homes in the area
Home Values in the Area
Average Home Value in this Area
Purchase History
| Date | Buyer | Sale Price | Title Company |
|---|---|---|---|
| Lien Alexandra | $120,000 | West Title Llc | |
| -- | $97,300 | -- | |
| Uppal Group Llc | $97,341 | Fsa Title Services Llc | |
| Loandepotcom Llc | $90,250 | Attorney | |
| Bruns Jennifer A | $127,500 | -- |
Source: Public Records
Mortgage History
| Date | Status | Borrower | Loan Amount |
|---|---|---|---|
| Previous Owner | Uppal Group Llc | $80,000 | |
| Previous Owner | -- | $97,341 |
Source: Public Records
Tax History Compared to Growth
Tax History
| Year | Tax Paid | Tax Assessment Tax Assessment Total Assessment is a certain percentage of the fair market value that is determined by local assessors to be the total taxable value of land and additions on the property. | Land | Improvement |
|---|---|---|---|---|
| 2024 | $1,300 | $120,000 | $9,000 | $111,000 |
| 2023 | $1,337 | $126,000 | $10,000 | $116,000 |
| 2022 | $1,926 | $133,000 | $10,000 | $123,000 |
| 2021 | $1,694 | $139,000 | $8,000 | $131,000 |
| 2020 | $1,762 | $126,500 | $5,600 | $120,900 |
| 2019 | $1,710 | $121,500 | $5,600 | $115,900 |
| 2018 | $1,608 | $114,500 | $5,600 | $108,900 |
| 2017 | $1,570 | $102,000 | $5,600 | $96,400 |
| 2016 | $1,699 | $107,000 | $5,600 | $101,400 |
| 2015 | $1,782 | $107,000 | $5,600 | $101,400 |
| 2014 | -- | $107,000 | $5,600 | $101,400 |
Source: Public Records
Map
Nearby Homes
- 3120 Hennepin Ave Unit 106
- 3120 Hennepin Ave Unit 103
- 3129 Holmes Ave
- 3041 Holmes Ave Unit 502
- 3041 Holmes Ave Unit 201
- 3140 Fremont Ave S
- 3209 Girard Ave S Unit 2
- 1510 W 31st St
- 3236 Hennepin Ave
- 1458 W 33rd St
- 3233 Fremont Ave S Unit 3
- 3252 Fremont Ave S Unit 2
- 3014 Emerson Ave S
- 3316 Humboldt Ave S
- 3217 E Bde Maka Ska Pkwy
- 3329 Girard Ave S
- 1623 W Lake St
- 3024 James Ave S
- 1211 Lagoon Ave Unit 508
- 1211 Lagoon Ave Unit 302
- 3120 Hennepin Ave Unit 308
- 3120 Hennepin Ave Unit 306
- 3120 Hennepin Ave Unit 305
- 3120 Hennepin Ave Unit 304
- 3120 Hennepin Ave Unit 303
- 3120 Hennepin Ave Unit 302
- 3120 Hennepin Ave Unit 301
- 3120 Hennepin Ave Unit 208
- 3120 Hennepin Ave Unit 207
- 3120 Hennepin Ave Unit 206
- 3120 Hennepin Ave Unit 204
- 3120 Hennepin Ave Unit 203
- 3120 Hennepin Ave Unit 202
- 3120 Hennepin Ave Unit 201
- 3120 Hennepin Ave Unit 108
- 3120 Hennepin Ave Unit 107
- 3120 Hennepin Ave Unit 105
- 3120 Hennepin Ave Unit 104
- 3120 Hennepin Ave Unit 102
- 3120 Hennepin Ave Unit 101