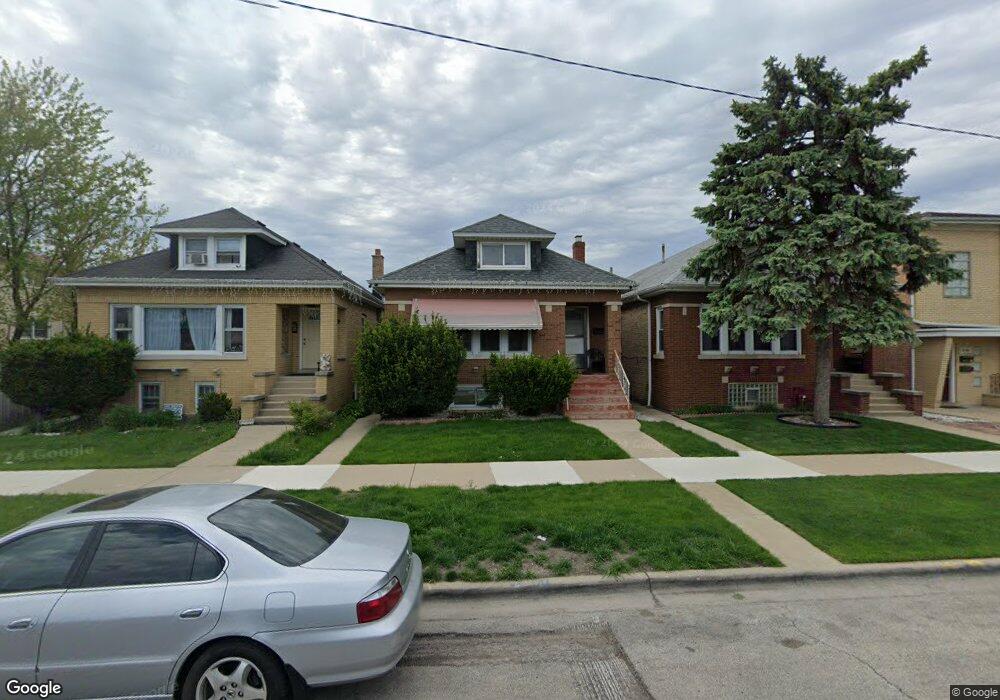
3120 N Lotus Ave Chicago, IL 60641
Cragin NeighborhoodEstimated Value: $342,000 - $458,000
3
Beds
2
Baths
1,642
Sq Ft
$245/Sq Ft
Est. Value
About This Home
This home is located at 3120 N Lotus Ave, Chicago, IL 60641 and is currently estimated at $402,864, approximately $245 per square foot. 3120 N Lotus Ave is a home located in Cook County with nearby schools including Camras Elementary School, Foreman College and Career Academy, and St Ferdinand Parish School.
Ownership History
Date
Name
Owned For
Owner Type
Purchase Details
Closed on
Dec 8, 2000
Sold by
Sierra Javier
Bought by
Sierra Javier and Sierra Rosa
Current Estimated Value
Home Financials for this Owner
Home Financials are based on the most recent Mortgage that was taken out on this home.
Original Mortgage
$153,000
Interest Rate
7.8%
Purchase Details
Closed on
Aug 11, 1999
Sold by
Wiszniewska Edwarda
Bought by
Sierra Javier
Home Financials for this Owner
Home Financials are based on the most recent Mortgage that was taken out on this home.
Original Mortgage
$116,200
Interest Rate
7.7%
Mortgage Type
Stand Alone First
Purchase Details
Closed on
Feb 17, 1998
Sold by
Cargill Theresa and Chraca Frank
Bought by
Wiszniewska Edwarda
Home Financials for this Owner
Home Financials are based on the most recent Mortgage that was taken out on this home.
Original Mortgage
$92,625
Interest Rate
5.62%
Create a Home Valuation Report for This Property
The Home Valuation Report is an in-depth analysis detailing your home's value as well as a comparison with similar homes in the area
Home Values in the Area
Average Home Value in this Area
Purchase History
| Date | Buyer | Sale Price | Title Company |
|---|---|---|---|
| Sierra Javier | -- | -- | |
| Sierra Javier | $166,000 | -- | |
| Wiszniewska Edwarda | $123,500 | -- |
Source: Public Records
Mortgage History
| Date | Status | Borrower | Loan Amount |
|---|---|---|---|
| Closed | Sierra Javier | $153,000 | |
| Closed | Sierra Javier | $116,200 | |
| Previous Owner | Wiszniewska Edwarda | $92,625 | |
| Closed | Sierra Javier | $33,200 |
Source: Public Records
Tax History Compared to Growth
Tax History
| Year | Tax Paid | Tax Assessment Tax Assessment Total Assessment is a certain percentage of the fair market value that is determined by local assessors to be the total taxable value of land and additions on the property. | Land | Improvement |
|---|---|---|---|---|
| 2024 | $4,602 | $32,000 | $6,993 | $25,007 |
| 2023 | $4,465 | $25,115 | $5,674 | $19,441 |
| 2022 | $4,465 | $25,115 | $5,674 | $19,441 |
| 2021 | $5,166 | $29,003 | $5,673 | $23,330 |
| 2020 | $4,638 | $23,909 | $4,725 | $19,184 |
| 2019 | $4,711 | $26,864 | $4,725 | $22,139 |
| 2018 | $4,631 | $26,864 | $4,725 | $22,139 |
| 2017 | $5,173 | $27,392 | $4,158 | $23,234 |
| 2016 | $4,989 | $27,392 | $4,158 | $23,234 |
| 2015 | $4,541 | $27,392 | $4,158 | $23,234 |
| 2014 | $4,174 | $25,048 | $3,780 | $21,268 |
| 2013 | $4,080 | $25,048 | $3,780 | $21,268 |
Source: Public Records
Map
Nearby Homes
- 3036 N Long Ave
- 5335 W Barry Ave
- 5435 W Melrose St
- 3036 N Luna Ave
- 2939 N Lotus Ave
- 5244 W Barry Ave
- 5243 W Oakdale Ave
- 3043 N Laramie Ave Unit 2
- 3045 N Laramie Ave Unit 2
- 5303 W George St
- 5254 W Wolfram St
- 2859 N Mango Ave
- 5529 W Cornelia Ave
- 5155 W Roscoe St
- 4918-22 W Diversey Ave
- 5254 W Newport Ave
- 5121 W Henderson St
- 5505 W Parker Ave
- 3450 N Central Ave
- 5041 W Fletcher St
- 3116 N Lotus Ave
- 3122 N Lotus Ave
- 3114 N Lotus Ave
- 3126 N Lotus Ave Unit 1
- 3128 N Lotus Ave
- 3110 N Lotus Ave
- 3108 N Lotus Ave
- 3132 N Lotus Ave
- 3117 N Linder Ave
- 3123 N Linder Ave
- 3134 N Lotus Ave
- 3104 N Lotus Ave
- 3115 N Linder Ave
- 3127 N Linder Ave
- 3121 N Linder Ave
- 3121 N Linder Ave
- 3111 N Linder Ave
- 3123 N Lotus Ave
- 3123 N Lotus Ave Unit 2
- 3129 N Linder Ave