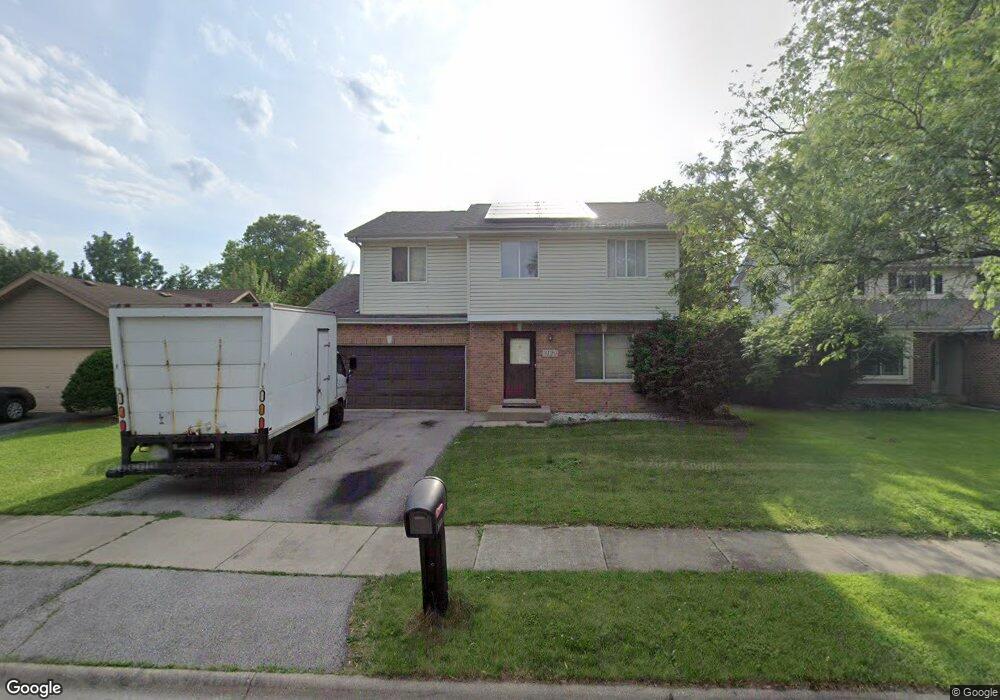
3120 Quincy Ln Unit 19E Aurora, IL 60504
South East Village NeighborhoodEstimated Value: $354,000 - $418,586
4
Beds
3
Baths
1,944
Sq Ft
$201/Sq Ft
Est. Value
About This Home
This home is located at 3120 Quincy Ln Unit 19E, Aurora, IL 60504 and is currently estimated at $390,647, approximately $200 per square foot. 3120 Quincy Ln Unit 19E is a home located in DuPage County with nearby schools including Gombert Elementary School, Fischer Middle School, and Waubonsie Valley High School.
Ownership History
Date
Name
Owned For
Owner Type
Purchase Details
Closed on
Jun 21, 2019
Sold by
Baffour Joseph K and Baffour Elizabeth K
Bought by
Baffour Elizabeth K
Current Estimated Value
Purchase Details
Closed on
Dec 10, 1999
Sold by
Hartley Paul B and Hartley Kelly L
Bought by
Baffour Joseph K and Nimakoh Elizabeth K
Home Financials for this Owner
Home Financials are based on the most recent Mortgage that was taken out on this home.
Original Mortgage
$147,725
Outstanding Balance
$46,280
Interest Rate
7.87%
Estimated Equity
$344,367
Purchase Details
Closed on
Oct 30, 1998
Sold by
Bielby Peter L and Bielby Kris A
Bought by
Hartley Paul B and Miller Kelly L
Home Financials for this Owner
Home Financials are based on the most recent Mortgage that was taken out on this home.
Original Mortgage
$139,680
Interest Rate
6.72%
Create a Home Valuation Report for This Property
The Home Valuation Report is an in-depth analysis detailing your home's value as well as a comparison with similar homes in the area
Home Values in the Area
Average Home Value in this Area
Purchase History
| Date | Buyer | Sale Price | Title Company |
|---|---|---|---|
| Baffour Elizabeth K | -- | First American Title Ins Co | |
| Baffour Joseph K | $155,500 | Premier Title | |
| Hartley Paul B | $144,000 | Law Title Pick Up |
Source: Public Records
Mortgage History
| Date | Status | Borrower | Loan Amount |
|---|---|---|---|
| Open | Baffour Joseph K | $147,725 | |
| Previous Owner | Hartley Paul B | $139,680 |
Source: Public Records
Tax History Compared to Growth
Tax History
| Year | Tax Paid | Tax Assessment Tax Assessment Total Assessment is a certain percentage of the fair market value that is determined by local assessors to be the total taxable value of land and additions on the property. | Land | Improvement |
|---|---|---|---|---|
| 2024 | $7,639 | $108,463 | $24,795 | $83,668 |
| 2023 | $7,270 | $97,460 | $22,280 | $75,180 |
| 2022 | $6,775 | $86,790 | $19,670 | $67,120 |
| 2021 | $6,591 | $83,690 | $18,970 | $64,720 |
| 2020 | $6,671 | $83,690 | $18,970 | $64,720 |
| 2019 | $6,430 | $79,600 | $18,040 | $61,560 |
| 2018 | $5,677 | $70,270 | $15,830 | $54,440 |
| 2017 | $5,575 | $67,880 | $15,290 | $52,590 |
| 2016 | $5,468 | $65,140 | $14,670 | $50,470 |
| 2015 | $5,402 | $61,850 | $13,930 | $47,920 |
| 2014 | $6,014 | $66,360 | $14,820 | $51,540 |
| 2013 | $5,953 | $66,820 | $14,920 | $51,900 |
Source: Public Records
Map
Nearby Homes
- 2860 Bridgeport Ln Unit 19D
- 3290 Johnsbury Ct
- 3144 Johnsbury Ln
- 1465 Bridgeport Ln Unit 19D
- 1334 Normantown Rd Unit 334
- 1335 Lawrence Ct
- 2730 Dorothy Dr Unit 1
- 2723 Rosehall Ln
- 2632 Emma Cir
- 3479 Charlemaine Dr
- 3185 Ketch Ct Unit 606
- 3467 Charlemaine Dr
- 2509 Rosehall Ln
- 3437 Charlemaine Dr
- 10S154 Schoger Dr
- 2489 Rosehall Ln
- 2077 Union Mill Dr
- 2476 Village Ct Unit 2
- 2538 Needham Ct
- 2484 Warwick Ct
- 3124 Quincy Ln Unit 19E
- 3116 Quincy Ln
- 3025 Bangor Ln
- 3035 Bangor Ln Unit 19D
- 3128 Quincy Ln
- 3112 Quincy Ln Unit 217
- 3045 Bangor Ln
- 3109 Quincy Ln
- 3113 Quincy Ln
- 3015 Bangor Ln Unit 19D
- 3132 Quincy Ln
- 3117 Quincy Ln
- 3055 Bangor Ln Unit 19D
- 3105 Quincy Ln
- 3108 Quincy Ln
- 3121 Quincy Ln Unit 19E
- 3136 Quincy Ln
- 3104 Quincy Ln
- 3030 Bangor Ln
- 3065 Bangor Ln Unit 19D