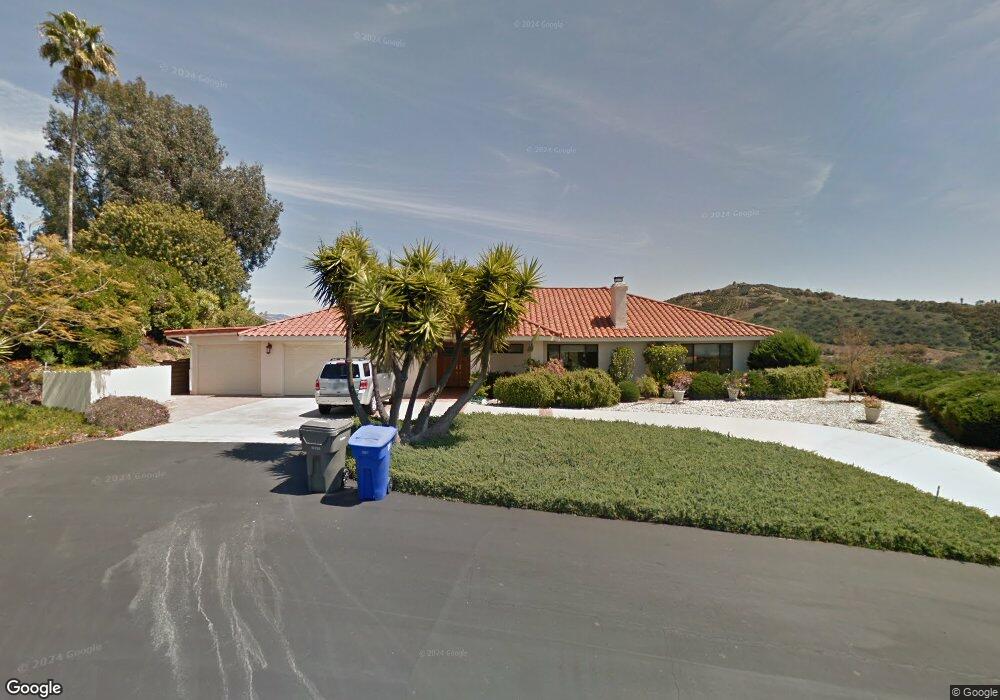
3120 Via Loma Fallbrook, CA 92028
Estimated Value: $1,048,379 - $1,293,000
3
Beds
3
Baths
2,600
Sq Ft
$448/Sq Ft
Est. Value
About This Home
This home is located at 3120 Via Loma, Fallbrook, CA 92028 and is currently estimated at $1,165,095, approximately $448 per square foot. 3120 Via Loma is a home located in San Diego County with nearby schools including Bonsall Elementary School, Sullivan Middle School, and Bonsall High.
Ownership History
Date
Name
Owned For
Owner Type
Purchase Details
Closed on
Mar 16, 2021
Sold by
Kerry James W and Kerry Gail H
Bought by
Kerry James W and Kerry Gail H
Current Estimated Value
Home Financials for this Owner
Home Financials are based on the most recent Mortgage that was taken out on this home.
Original Mortgage
$548,250
Outstanding Balance
$491,467
Interest Rate
2.7%
Mortgage Type
New Conventional
Estimated Equity
$673,628
Purchase Details
Closed on
Sep 1, 2004
Sold by
Kerry James W and Kerry Gail H
Bought by
Kerry James W and Kerry Gail H
Purchase Details
Closed on
Nov 5, 2002
Sold by
Larsen Jean
Bought by
Kerry James and Kerry Gail
Home Financials for this Owner
Home Financials are based on the most recent Mortgage that was taken out on this home.
Original Mortgage
$300,000
Interest Rate
5.89%
Purchase Details
Closed on
May 5, 2000
Sold by
Kuster Wilma M
Bought by
Kuster Wilma M
Purchase Details
Closed on
Jun 19, 1984
Create a Home Valuation Report for This Property
The Home Valuation Report is an in-depth analysis detailing your home's value as well as a comparison with similar homes in the area
Home Values in the Area
Average Home Value in this Area
Purchase History
| Date | Buyer | Sale Price | Title Company |
|---|---|---|---|
| Kerry James W | -- | Accommodation | |
| Kerry James W | -- | Pacific Coast Title | |
| Kerry James W | -- | -- | |
| Kerry James | $470,000 | First American Title | |
| Kuster Wilma M | -- | -- | |
| -- | $50,000 | -- |
Source: Public Records
Mortgage History
| Date | Status | Borrower | Loan Amount |
|---|---|---|---|
| Open | Kerry James W | $548,250 | |
| Closed | Kerry James | $300,000 |
Source: Public Records
Tax History Compared to Growth
Tax History
| Year | Tax Paid | Tax Assessment Tax Assessment Total Assessment is a certain percentage of the fair market value that is determined by local assessors to be the total taxable value of land and additions on the property. | Land | Improvement |
|---|---|---|---|---|
| 2025 | $1,063 | $105,604 | $24,255 | $81,349 |
| 2024 | $1,063 | $103,534 | $23,780 | $79,754 |
| 2023 | $1,038 | $101,505 | $23,314 | $78,191 |
| 2022 | $1,019 | $99,515 | $22,857 | $76,658 |
| 2021 | $1,001 | $97,564 | $22,409 | $75,155 |
| 2020 | $992 | $96,565 | $22,180 | $74,385 |
| 2019 | $973 | $94,673 | $21,746 | $72,927 |
| 2018 | $976 | $92,818 | $21,320 | $71,498 |
| 2017 | $956 | $90,999 | $20,902 | $70,097 |
| 2016 | $931 | $89,216 | $20,493 | $68,723 |
| 2015 | $916 | $87,877 | $20,186 | $67,691 |
| 2014 | $898 | $86,157 | $19,791 | $66,366 |
Source: Public Records
Map
Nearby Homes
- 3064 Via Loma
- 3149 Old Post Rd
- 2975 Dos Lomas
- 3519 Cherrybrook Ct
- 3524 Lake Garden Dr
- 2869 Dos Lomas Place
- 2860 Via Rancheros Way
- 2511 Via Rancheros
- 3501 Monserate Hill Rd
- 3863 Flowerwood Ln
- 3647 Laketree Dr
- 2114 Vista Valle Verde Dr
- 4009-11 Flowerwood Ln
- 0 Esterlina Dr Unit NDP2504269
- 3456 Los Sicomoros Ln
- 2253 55 Via Dulcea
- 2614 Secret Lake Ln
- 2255 Via Dulcea
- 2798 Alta Vista Dr
- 4408 Brodea Ln
- 3106 Via Loma
- 3142 Via Loma
- 3069 Via Loma
- 3068 Via Loma
- 3331 Vía Loma Unit 3331
- 3331 Vía Loma Unit PB000
- 3059 Vía Loma
- 0 Vía Loma
- 3411 Caballo Ln
- 3410 Caballo Ln
- 2692 Via Alicia
- 3275 Via Loma
- 3620 Rosewood Place
- 3415 Caballo Ln
- 3278 Via Loma
- 3607 Rosewood Place
- 2674 Via Alicia
- 3309 Via Loma
- 3033 Via Loma
- 3625 Rosewood Place