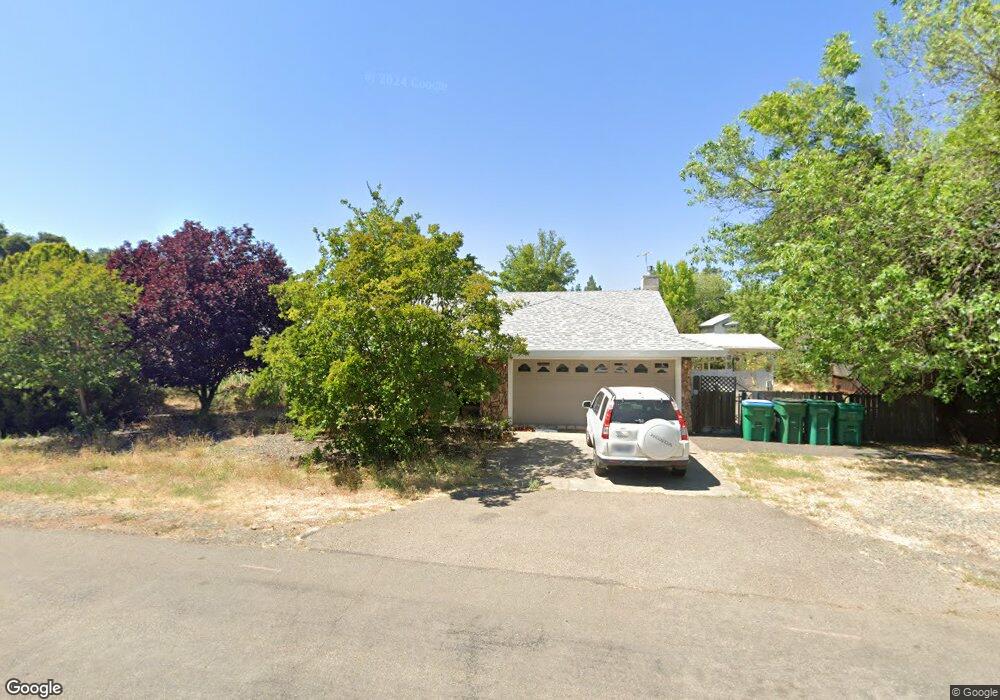
3121 Cambridge Ct Cameron Park, CA 95682
Estimated Value: $468,000 - $574,000
3
Beds
2
Baths
1,878
Sq Ft
$287/Sq Ft
Est. Value
About This Home
This home is located at 3121 Cambridge Ct, Cameron Park, CA 95682 and is currently estimated at $538,251, approximately $286 per square foot. 3121 Cambridge Ct is a home located in El Dorado County with nearby schools including Rescue Elementary School, Pleasant Grove Middle School, and Ponderosa High School.
Ownership History
Date
Name
Owned For
Owner Type
Purchase Details
Closed on
Aug 15, 2024
Sold by
Clarence Ladell Tracy Revocable Living T and Tracy Lindsey M
Bought by
Tracy Ryan A
Current Estimated Value
Purchase Details
Closed on
Sep 27, 2018
Sold by
Tracy Clarence Ladell and Tracy Clarence R
Bought by
Tracy Clarence Ladell and Tracy Clarence Ladell
Purchase Details
Closed on
Dec 19, 2006
Sold by
Tracy Clarence R and Tracy Minnie M
Bought by
Tracy Clarence R and Tracy Minnie Mae
Purchase Details
Closed on
Mar 27, 1995
Sold by
Krossa Delouris M and Krossa Lester D
Bought by
Tracy Clarence R and Tracy Minnie M
Home Financials for this Owner
Home Financials are based on the most recent Mortgage that was taken out on this home.
Original Mortgage
$129,600
Interest Rate
6.62%
Create a Home Valuation Report for This Property
The Home Valuation Report is an in-depth analysis detailing your home's value as well as a comparison with similar homes in the area
Home Values in the Area
Average Home Value in this Area
Purchase History
| Date | Buyer | Sale Price | Title Company |
|---|---|---|---|
| Tracy Ryan A | -- | None Listed On Document | |
| Tracy Clarence Ladell | -- | None Available | |
| Tracy Clarence R | -- | None Available | |
| Tracy Clarence R | $162,000 | Fidelity National Title |
Source: Public Records
Mortgage History
| Date | Status | Borrower | Loan Amount |
|---|---|---|---|
| Previous Owner | Tracy Clarence R | $129,600 |
Source: Public Records
Tax History
| Year | Tax Paid | Tax Assessment Tax Assessment Total Assessment is a certain percentage of the fair market value that is determined by local assessors to be the total taxable value of land and additions on the property. | Land | Improvement |
|---|---|---|---|---|
| 2025 | $2,982 | $272,068 | $67,165 | $204,903 |
| 2024 | $2,982 | $266,735 | $65,849 | $200,886 |
| 2023 | $2,930 | $261,506 | $64,558 | $196,948 |
| 2022 | $2,892 | $256,380 | $63,293 | $193,087 |
| 2021 | $2,874 | $251,353 | $62,052 | $189,301 |
| 2020 | $2,822 | $248,776 | $61,416 | $187,360 |
| 2019 | $2,775 | $243,899 | $60,212 | $183,687 |
| 2018 | $2,699 | $239,118 | $59,032 | $180,086 |
| 2017 | $2,574 | $234,430 | $57,875 | $176,555 |
| 2016 | $2,547 | $229,835 | $56,741 | $173,094 |
| 2015 | $2,460 | $226,385 | $55,890 | $170,495 |
| 2014 | $2,460 | $221,953 | $54,797 | $167,156 |
Source: Public Records
Map
Nearby Homes
- 3126 Oxford Rd
- 3379 Cambridge Rd
- 3770 Dita Ct
- 3053 Cambridge Rd
- 2960 Pasada Rd
- 3271 Woodleigh Ln
- 3300 Woodleigh Ln
- 3505 Fairway Dr
- 3033 Estepa Dr Unit 7A
- 0 Rancho Tierra Ct
- 3044 Boeing Rd
- 2980 Calido Ct
- 3341 Rancho Tierra Ct
- 0 Wilkinson Rd
- 0 Wilkinson Rd
- 2886 Knollwood Dr
- 3590 Montclair Rd
- 2779 Osborne Rd
- 993 Camerado Dr
- 421 Ashland Ct
- 3129 Cambridge Ct
- 3120 Cambridge Ct
- 3312 Cambridge Rd
- 3128 Cambridge Ct
- 3304 Cambridge Rd
- 3137 Cambridge Ct
- 3320 Cambridge Rd
- 3132 Oxford Rd
- 3296 Cambridge Rd
- 3134 Cambridge Ct
- 3326 Cambridge Rd
- 3289 Cambridge Rd
- 3335 Cambridge Rd
- 3313 Granada Dr
- 3290 Cambridge Rd
- 3294 Salida Way
- 3305 Granada Dr
- 3321 Granada Dr
- 3107 Pasada Rd
- 3141 Cambridge Ct
Your Personal Tour Guide
Ask me questions while you tour the home.