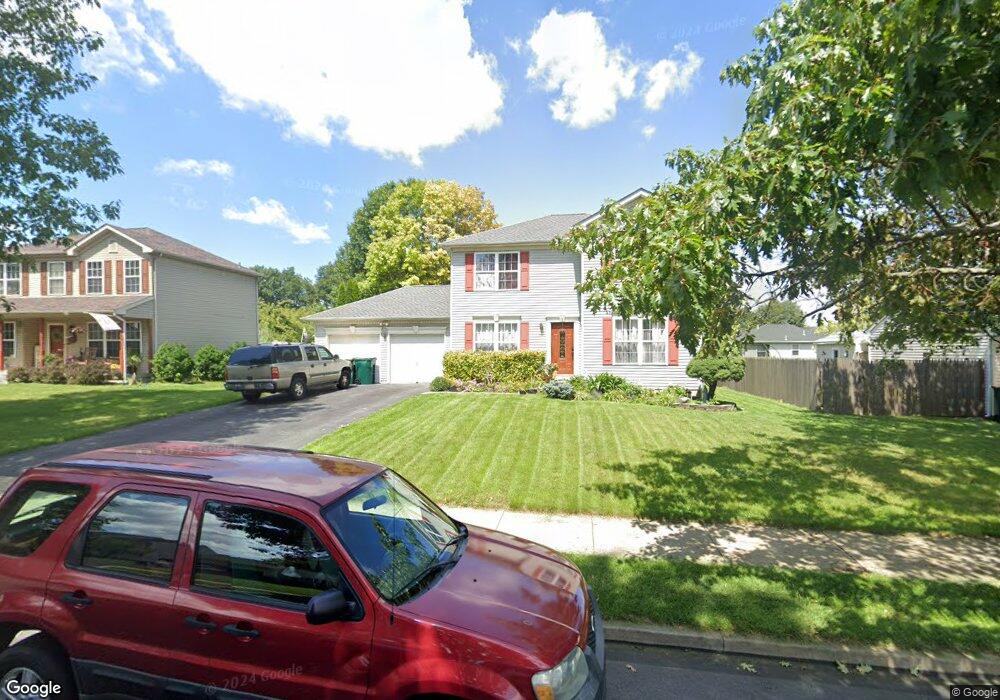
3121 Glen Ave Easton, PA 18045
Estimated Value: $421,418 - $449,000
3
Beds
3
Baths
1,596
Sq Ft
$272/Sq Ft
Est. Value
About This Home
This home is located at 3121 Glen Ave, Easton, PA 18045 and is currently estimated at $433,355, approximately $271 per square foot. 3121 Glen Ave is a home located in Northampton County with nearby schools including Palmer Elementary School, Easton Area Middle School, and Easton Area High School.
Ownership History
Date
Name
Owned For
Owner Type
Purchase Details
Closed on
Apr 17, 2012
Sold by
Vega Ricardo T and Vega Maria S
Bought by
Vega Ricardo T and Vega Maria S
Current Estimated Value
Home Financials for this Owner
Home Financials are based on the most recent Mortgage that was taken out on this home.
Original Mortgage
$279,770
Outstanding Balance
$191,775
Interest Rate
3.75%
Mortgage Type
FHA
Estimated Equity
$241,580
Purchase Details
Closed on
Apr 1, 1998
Bought by
Vega Ricardo T
Create a Home Valuation Report for This Property
The Home Valuation Report is an in-depth analysis detailing your home's value as well as a comparison with similar homes in the area
Home Values in the Area
Average Home Value in this Area
Purchase History
| Date | Buyer | Sale Price | Title Company |
|---|---|---|---|
| Vega Ricardo T | -- | First American Title Insuran | |
| Vega Ricardo T | $162,000 | -- |
Source: Public Records
Mortgage History
| Date | Status | Borrower | Loan Amount |
|---|---|---|---|
| Open | Vega Ricardo T | $279,770 |
Source: Public Records
Tax History Compared to Growth
Tax History
| Year | Tax Paid | Tax Assessment Tax Assessment Total Assessment is a certain percentage of the fair market value that is determined by local assessors to be the total taxable value of land and additions on the property. | Land | Improvement |
|---|---|---|---|---|
| 2025 | $733 | $67,900 | $18,800 | $49,100 |
| 2024 | $6,017 | $67,900 | $18,800 | $49,100 |
| 2023 | $5,910 | $67,900 | $18,800 | $49,100 |
| 2022 | $5,821 | $67,900 | $18,800 | $49,100 |
| 2021 | $5,802 | $67,900 | $18,800 | $49,100 |
| 2020 | $5,799 | $67,900 | $18,800 | $49,100 |
| 2019 | $5,717 | $67,900 | $18,800 | $49,100 |
| 2018 | $5,619 | $67,900 | $18,800 | $49,100 |
| 2017 | $5,486 | $67,900 | $18,800 | $49,100 |
| 2016 | -- | $67,900 | $18,800 | $49,100 |
| 2015 | -- | $67,900 | $18,800 | $49,100 |
| 2014 | -- | $67,900 | $18,800 | $49,100 |
Source: Public Records
Map
Nearby Homes