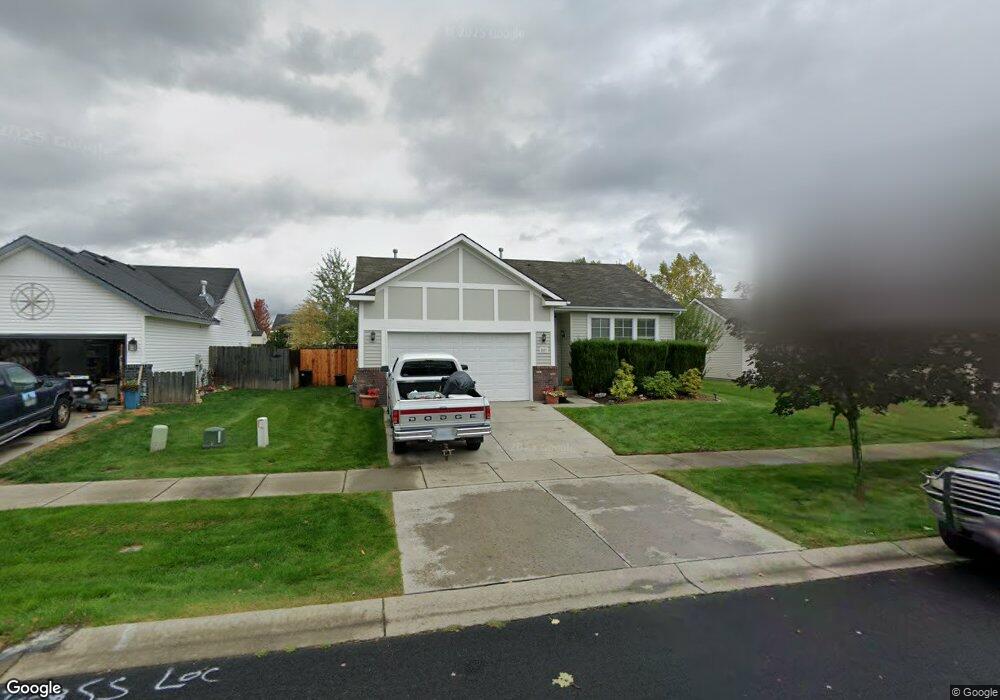
3121 N Alfalfa Loop Post Falls, ID 83854
North Prairie NeighborhoodEstimated Value: $420,527 - $449,000
3
Beds
2
Baths
1,193
Sq Ft
$363/Sq Ft
Est. Value
About This Home
This home is located at 3121 N Alfalfa Loop, Post Falls, ID 83854 and is currently estimated at $432,632, approximately $362 per square foot. 3121 N Alfalfa Loop is a home located in Kootenai County with nearby schools including Prairie View Elementary School, Post Falls Middle School, and Post Falls High School.
Ownership History
Date
Name
Owned For
Owner Type
Purchase Details
Closed on
Sep 12, 2016
Sold by
Morfin Anita
Bought by
Morrow Riker
Current Estimated Value
Home Financials for this Owner
Home Financials are based on the most recent Mortgage that was taken out on this home.
Original Mortgage
$178,212
Outstanding Balance
$145,189
Interest Rate
4.4%
Mortgage Type
FHA
Estimated Equity
$287,443
Purchase Details
Closed on
Jun 29, 2006
Sold by
Bruce Greg M and Bruce Joy L
Bought by
Morfin Anita
Home Financials for this Owner
Home Financials are based on the most recent Mortgage that was taken out on this home.
Original Mortgage
$109,500
Interest Rate
6.96%
Mortgage Type
Adjustable Rate Mortgage/ARM
Purchase Details
Closed on
Jan 7, 2005
Sold by
Viking Construction Inc
Bought by
Bruce Greg M and Bruce Joy L
Home Financials for this Owner
Home Financials are based on the most recent Mortgage that was taken out on this home.
Original Mortgage
$103,685
Interest Rate
6.25%
Mortgage Type
Adjustable Rate Mortgage/ARM
Create a Home Valuation Report for This Property
The Home Valuation Report is an in-depth analysis detailing your home's value as well as a comparison with similar homes in the area
Home Values in the Area
Average Home Value in this Area
Purchase History
| Date | Buyer | Sale Price | Title Company |
|---|---|---|---|
| Morrow Riker | -- | Kootenai County Title Compan | |
| Morfin Anita | -- | -- | |
| Bruce Greg M | -- | None Available |
Source: Public Records
Mortgage History
| Date | Status | Borrower | Loan Amount |
|---|---|---|---|
| Open | Morrow Riker | $178,212 | |
| Previous Owner | Morfin Anita | $109,500 | |
| Previous Owner | Bruce Greg M | $103,685 |
Source: Public Records
Tax History
| Year | Tax Paid | Tax Assessment Tax Assessment Total Assessment is a certain percentage of the fair market value that is determined by local assessors to be the total taxable value of land and additions on the property. | Land | Improvement |
|---|---|---|---|---|
| 2025 | $1,389 | $377,230 | $175,000 | $202,230 |
| 2024 | $1,429 | $376,980 | $152,000 | $224,980 |
| 2023 | $1,429 | $402,978 | $160,000 | $242,978 |
| 2022 | $1,893 | $427,476 | $157,500 | $269,976 |
| 2021 | $1,528 | $271,910 | $105,000 | $166,910 |
| 2020 | $1,610 | $237,640 | $90,000 | $147,640 |
| 2019 | $1,464 | $212,320 | $90,000 | $122,320 |
| 2018 | $1,316 | $181,560 | $70,000 | $111,560 |
| 2017 | $1,260 | $158,870 | $50,000 | $108,870 |
| 2016 | $2,213 | $136,960 | $40,000 | $96,960 |
| 2015 | $2,196 | $133,740 | $37,000 | $96,740 |
| 2013 | $2,085 | $117,350 | $32,000 | $85,350 |
Source: Public Records
Map
Nearby Homes
- 2533 N Side Saddle Ln
- 2325 N Mackenzie Dr
- 2815 N Sand Trap Way
- 2489 N Side Saddle Ln
- 2744 N Alfalfa Loop
- 2770 N Slice
- 561 E Sand Wedge Dr
- 910 E Shasta Ave
- 2435 N Bunchgrass Dr
- 2103 N Mackenzie Dr
- 908 E Allenby Ct
- 984 E Allenby Ave
- 880 E Allenby Ct
- 1074 E Allenby Ave
- 2110 N Triumph Ct
- 2441 N Henry St
- 1039 E Blair Ave
- 2430 N Titleist Way
- 1412 E Allenby Ave
- 3265 N Segar Loop
- 3139 N Alfalfa Loop
- 3101 N Alfalfa Loop
- 3083 N Alfalfa Loop
- 2699 N Ivy Ln
- 3159 N Alfalfa Loop
- 2715 N Ivy Ln
- 2675 N Ivy Ln
- 2733 N Ivy Ln
- 3112 N Alfalfa Loop
- 3094 N Alfalfa Loop
- 3130 N Alfalfa Loop
- 3181 N Alfalfa Loop
- 2657 N Ivy Ln
- 3150 N Alfalfa Loop
- 2755 N Ivy Ln
- 3055 N Alfalfa Loop
- 3072 N Alfalfa Loop
- 3164 N Alfalfa Loop
- 3203 N Alfalfa Loop
- 2771 N Ivy Ln
Your Personal Tour Guide
Ask me questions while you tour the home.