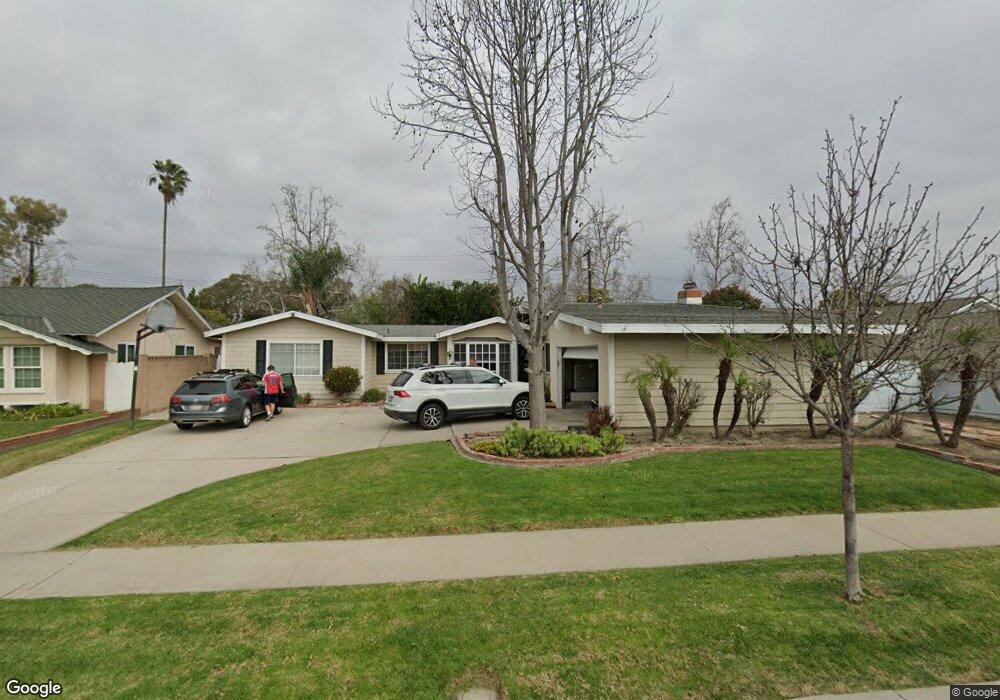
3121 Quail Run Rd Los Alamitos, CA 90720
Rossmoor NeighborhoodEstimated Value: $1,445,389 - $1,685,000
4
Beds
2
Baths
1,895
Sq Ft
$846/Sq Ft
Est. Value
About This Home
This home is located at 3121 Quail Run Rd, Los Alamitos, CA 90720 and is currently estimated at $1,603,097, approximately $845 per square foot. 3121 Quail Run Rd is a home located in Orange County with nearby schools including Richard Henry Lee Elementary School, Jack L. Weaver Elementary School, and Oak Middle School.
Ownership History
Date
Name
Owned For
Owner Type
Purchase Details
Closed on
Nov 10, 2010
Sold by
Dorosky David and Dorosky Jennifer
Bought by
Dorosky David B and Dorosky Jennifer C
Current Estimated Value
Purchase Details
Closed on
Aug 16, 2010
Sold by
Norman Dan A and Norman Karla J
Bought by
Dorosky David and Dorosky Jennifer
Home Financials for this Owner
Home Financials are based on the most recent Mortgage that was taken out on this home.
Original Mortgage
$552,500
Outstanding Balance
$363,589
Interest Rate
4.45%
Mortgage Type
New Conventional
Estimated Equity
$1,239,508
Purchase Details
Closed on
Mar 12, 1999
Sold by
Gamby Russell L and Gamby Patricia Patricia
Bought by
Norman Dan A and Norman Karla J
Home Financials for this Owner
Home Financials are based on the most recent Mortgage that was taken out on this home.
Original Mortgage
$205,000
Interest Rate
6.79%
Create a Home Valuation Report for This Property
The Home Valuation Report is an in-depth analysis detailing your home's value as well as a comparison with similar homes in the area
Home Values in the Area
Average Home Value in this Area
Purchase History
| Date | Buyer | Sale Price | Title Company |
|---|---|---|---|
| Dorosky David B | -- | None Available | |
| Dorosky David | $750,000 | Ticor Title Company | |
| Norman Dan A | -- | Chicago Title Co |
Source: Public Records
Mortgage History
| Date | Status | Borrower | Loan Amount |
|---|---|---|---|
| Open | Dorosky David | $552,500 | |
| Previous Owner | Norman Dan A | $205,000 |
Source: Public Records
Tax History Compared to Growth
Tax History
| Year | Tax Paid | Tax Assessment Tax Assessment Total Assessment is a certain percentage of the fair market value that is determined by local assessors to be the total taxable value of land and additions on the property. | Land | Improvement |
|---|---|---|---|---|
| 2025 | $10,997 | $960,878 | $822,447 | $138,431 |
| 2024 | $10,997 | $942,038 | $806,321 | $135,717 |
| 2023 | $10,749 | $923,567 | $790,511 | $133,056 |
| 2022 | $10,713 | $905,458 | $775,010 | $130,448 |
| 2021 | $10,482 | $887,704 | $759,813 | $127,891 |
| 2020 | $10,521 | $878,602 | $752,022 | $126,580 |
| 2019 | $10,203 | $861,375 | $737,276 | $124,099 |
| 2018 | $9,790 | $844,486 | $722,820 | $121,666 |
| 2017 | $9,587 | $827,928 | $708,647 | $119,281 |
| 2016 | $9,406 | $811,695 | $694,752 | $116,943 |
| 2015 | $9,329 | $799,503 | $684,316 | $115,187 |
| 2014 | $9,007 | $783,842 | $670,911 | $112,931 |
Source: Public Records
Map
Nearby Homes
- 3122 Ruth Elaine Dr
- 11291 Wembley Rd
- 11385 Baskerville Rd
- 10681 Oak St Unit 29
- 7890 E Spring St Unit 5I
- 7890 E Spring St Unit 19A
- 7890 E Spring St Unit 21I
- 7890 E Spring St Unit 13I
- 7890 E Spring St Unit 2F
- 2912 Claremore Ln
- 10842 Pine St
- 3312 Kenilworth Dr
- 10572 Acorn Place
- 3311 Rossmoor Way
- 3804 Howard Ave
- 3361 Rossmoor Way
- 3802 Howard Ave
- 3091 Marna Ave
- 11741 Foster Rd
- 3845 Farquhar Ave Unit 110
- 3111 Quail Run Rd
- 3131 Quail Run Rd
- 3132 Ruth Elaine Dr
- 3112 Ruth Elaine Dr
- 3141 Quail Run Rd
- 3101 Quail Run Rd
- 3122 Quail Run Rd
- 3102 Ruth Elaine Dr
- 3142 Ruth Elaine Dr
- 3112 Quail Run Rd
- 3132 Quail Run Rd
- 3161 Quail Run Rd
- 3091 Quail Run Rd
- 3102 Quail Run Rd
- 3142 Quail Run Rd
- 3092 Ruth Elaine Dr
- 3162 Ruth Elaine Dr
- 3162 Quail Run Rd
- 3092 Quail Run Rd
- 3071 Quail Run Rd