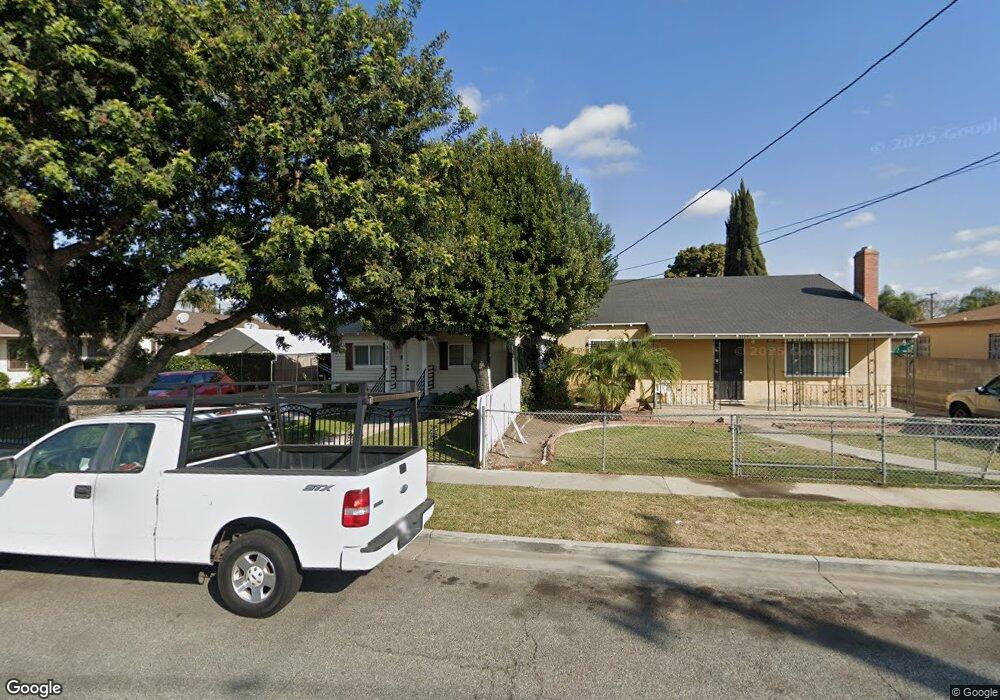
3121 Virginia St Lynwood, CA 90262
Estimated Value: $549,000 - $597,000
2
Beds
1
Bath
688
Sq Ft
$836/Sq Ft
Est. Value
About This Home
This home is located at 3121 Virginia St, Lynwood, CA 90262 and is currently estimated at $575,096, approximately $835 per square foot. 3121 Virginia St is a home located in Los Angeles County with nearby schools including Lindbergh Elementary School, Lynwood Middle School, and Marco Antonio Firebaugh High School.
Ownership History
Date
Name
Owned For
Owner Type
Purchase Details
Closed on
Feb 7, 2006
Sold by
Lugo Gabriela Navarrete
Bought by
Lugo Jose Adalberto
Current Estimated Value
Home Financials for this Owner
Home Financials are based on the most recent Mortgage that was taken out on this home.
Original Mortgage
$170,000
Interest Rate
6.15%
Mortgage Type
New Conventional
Purchase Details
Closed on
Jan 26, 1995
Sold by
Hernandez Miguel A
Bought by
Lugo Jose Adalberto
Home Financials for this Owner
Home Financials are based on the most recent Mortgage that was taken out on this home.
Original Mortgage
$119,220
Interest Rate
8.77%
Mortgage Type
FHA
Purchase Details
Closed on
Sep 29, 1994
Sold by
Castle Charlotte L
Bought by
Hernandez Miguel A
Home Financials for this Owner
Home Financials are based on the most recent Mortgage that was taken out on this home.
Original Mortgage
$20,000
Interest Rate
8.54%
Create a Home Valuation Report for This Property
The Home Valuation Report is an in-depth analysis detailing your home's value as well as a comparison with similar homes in the area
Home Values in the Area
Average Home Value in this Area
Purchase History
| Date | Buyer | Sale Price | Title Company |
|---|---|---|---|
| Lugo Jose Adalberto | -- | North American Title Co | |
| Lugo Jose Adalberto | $120,000 | Commonwealth Land Title Co | |
| Hernandez Miguel A | $20,000 | First Southwestern Title Co | |
| Hernandez Miguel A | -- | First Southwestern Title Co |
Source: Public Records
Mortgage History
| Date | Status | Borrower | Loan Amount |
|---|---|---|---|
| Closed | Lugo Jose Adalberto | $170,000 | |
| Previous Owner | Lugo Jose Adalberto | $119,220 | |
| Previous Owner | Hernandez Miguel A | $20,000 |
Source: Public Records
Tax History Compared to Growth
Tax History
| Year | Tax Paid | Tax Assessment Tax Assessment Total Assessment is a certain percentage of the fair market value that is determined by local assessors to be the total taxable value of land and additions on the property. | Land | Improvement |
|---|---|---|---|---|
| 2025 | $3,213 | $201,527 | $129,317 | $72,210 |
| 2024 | $3,213 | $197,577 | $126,782 | $70,795 |
| 2023 | $3,190 | $193,704 | $124,297 | $69,407 |
| 2022 | $3,083 | $189,907 | $121,860 | $68,047 |
| 2021 | $2,980 | $186,184 | $119,471 | $66,713 |
| 2019 | $3,041 | $180,663 | $115,928 | $64,735 |
| 2018 | $2,776 | $177,121 | $113,655 | $63,466 |
| 2016 | $2,598 | $170,245 | $109,243 | $61,002 |
| 2015 | $2,549 | $167,689 | $107,603 | $60,086 |
| 2014 | $2,499 | $164,405 | $105,496 | $58,909 |
Source: Public Records
Map
Nearby Homes
- 11952 Santa fe Ave
- 3234 Cedar Ave
- 3276 Cedar Ave
- 3370 Josephine St
- 536 E El Segundo Blvd
- 2618 E 124th St
- 2975 Fernwood Ave
- 12434 Peach St Unit A-B
- 12008 Long Beach Blvd
- 2623 E 127th St
- 2534 E 127th St
- 3226 Palm Ave
- 2622 E 129th St
- 3617 Cedar Ave
- 3130 Euclid Ave
- 12624 S Mona Blvd
- 11464 Copeland St
- 2443 E 124th St
- 11460 Copeland St
- 2531 E 131st St
- 3119 Virginia St
- 3127 Virginia St
- 3115 Virginia St
- 3133 Virginia St
- 3137 Virginia St
- 3136 Josephine St
- 3138 Josephine St
- 3128 Josephine St
- 3144 Josephine St
- 3124 Josephine St Unit B
- 3109 Virginia St
- 11820 State St
- 11816 State St
- 3146 Josephine St
- 3118 Josephine St
- 3114 Virginia St
- 3120 Virginia St
- 3132 Virginia St
- 3136 Virginia St
- 11821 Peach St