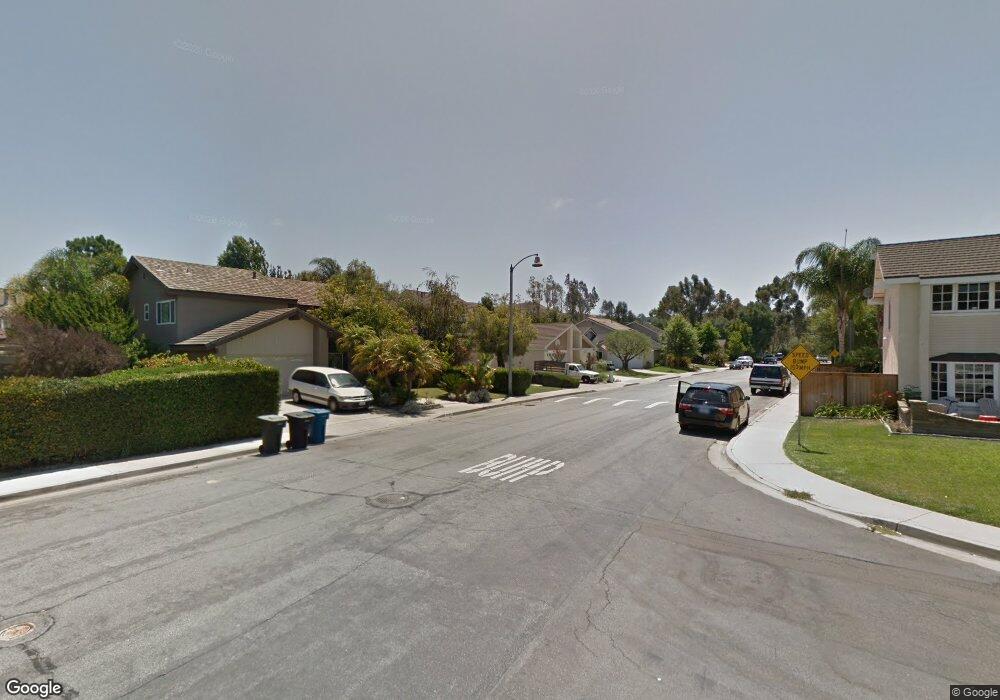
31212 Via Cordova San Juan Capistrano, CA 92675
Estimated Value: $1,190,873 - $1,346,000
4
Beds
2
Baths
1,662
Sq Ft
$770/Sq Ft
Est. Value
About This Home
This home is located at 31212 Via Cordova, San Juan Capistrano, CA 92675 and is currently estimated at $1,279,718, approximately $769 per square foot. 31212 Via Cordova is a home located in Orange County with nearby schools including Harold Ambuehl Elementary School, Marco Forster Middle School, and San Juan Hills High School.
Ownership History
Date
Name
Owned For
Owner Type
Purchase Details
Closed on
Nov 19, 2020
Sold by
Backal William R and Backal Betsy J
Bought by
Backal William R and Backal Betsy J
Current Estimated Value
Purchase Details
Closed on
Feb 21, 1998
Sold by
Small Elaine B
Bought by
Backal William R and Backal Betsy J
Home Financials for this Owner
Home Financials are based on the most recent Mortgage that was taken out on this home.
Original Mortgage
$207,200
Outstanding Balance
$36,680
Interest Rate
7%
Estimated Equity
$1,243,038
Purchase Details
Closed on
Aug 16, 1996
Sold by
Westgate Elaine B
Bought by
Small Elaine B
Create a Home Valuation Report for This Property
The Home Valuation Report is an in-depth analysis detailing your home's value as well as a comparison with similar homes in the area
Home Values in the Area
Average Home Value in this Area
Purchase History
| Date | Buyer | Sale Price | Title Company |
|---|---|---|---|
| Backal William R | -- | None Available | |
| Backal William R | $259,000 | Guardian Title Company | |
| Small Elaine B | -- | Chicago Title Co |
Source: Public Records
Mortgage History
| Date | Status | Borrower | Loan Amount |
|---|---|---|---|
| Open | Backal William R | $207,200 |
Source: Public Records
Tax History Compared to Growth
Tax History
| Year | Tax Paid | Tax Assessment Tax Assessment Total Assessment is a certain percentage of the fair market value that is determined by local assessors to be the total taxable value of land and additions on the property. | Land | Improvement |
|---|---|---|---|---|
| 2025 | $4,463 | $413,547 | $249,815 | $163,732 |
| 2024 | $4,463 | $405,439 | $244,917 | $160,522 |
| 2023 | $4,311 | $397,490 | $240,115 | $157,375 |
| 2022 | $3,960 | $389,697 | $235,407 | $154,290 |
| 2021 | $3,886 | $382,056 | $230,791 | $151,265 |
| 2020 | $3,851 | $378,139 | $228,425 | $149,714 |
| 2019 | $3,779 | $370,725 | $223,946 | $146,779 |
| 2018 | $3,710 | $363,456 | $219,555 | $143,901 |
| 2017 | $3,674 | $356,330 | $215,250 | $141,080 |
| 2016 | $3,605 | $349,344 | $211,030 | $138,314 |
| 2015 | $3,549 | $344,097 | $207,860 | $136,237 |
| 2014 | $3,485 | $337,357 | $203,788 | $133,569 |
Source: Public Records
Map
Nearby Homes
- 31192 Via Cordova
- 30967 Steeplechase Dr
- 30932 Steeplechase Dr
- 27681 Paseo Esteban
- 10 Strawberry Ln
- 27703 Ortega Hwy Unit 127
- 27703 Ortega Hwy Unit 13
- 31321 Via Las Palmas
- 31062 Casa Grande Dr
- 28051 Calle Santa Ynez
- 27591 Rolling Wood Ln
- 28481 Avenida la Mancha
- 27821 Golden Ridge Ln
- 28484 Via Mambrino
- 27972 Golden Ridge Ln
- 27782 Via Madrina
- 27381 Via Priorato
- 27281 Calle de la Rosa
- 31645 Rancho Viejo Rd
- 30402 Marbella Vista
- 31202 Via Cordova
- 31222 Via Cordova
- 31232 Via Cordova
- 31211 Via Solana
- 31201 Via Solana
- 31221 Via Solana
- 31242 Via Cordova
- 28092 Paseo Ventura
- 31211 Via Cordova
- 31221 Via Cordova
- 31181 Via Solana
- 31231 Via Solana
- 28122 Calle Raquel
- 28112 Calle Raquel
- 31252 Via Cordova
- 28082 Paseo Ventura
- 28091 Paseo Verde
- 31171 Via Solana
- 31241 Via Solana
- 28072 Paseo Ventura