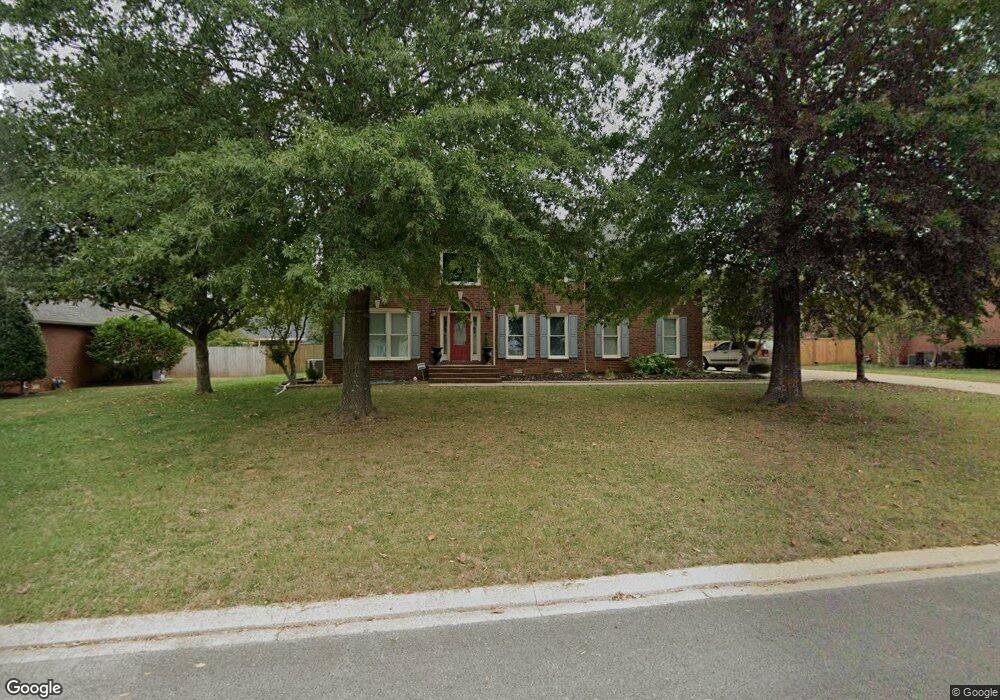
3122 Evreux Dr Murfreesboro, TN 37129
Estimated Value: $578,604 - $621,000
--
Bed
4
Baths
2,756
Sq Ft
$219/Sq Ft
Est. Value
About This Home
This home is located at 3122 Evreux Dr, Murfreesboro, TN 37129 and is currently estimated at $602,651, approximately $218 per square foot. 3122 Evreux Dr is a home located in Rutherford County with nearby schools including Erma Siegel Elementary School, Siegel Middle School, and Siegel High School.
Ownership History
Date
Name
Owned For
Owner Type
Purchase Details
Closed on
Sep 10, 2003
Sold by
Humberg Mario E and Humberg Tania R
Bought by
Vick Robert L and Vick Sherell T
Current Estimated Value
Home Financials for this Owner
Home Financials are based on the most recent Mortgage that was taken out on this home.
Original Mortgage
$123,000
Interest Rate
6.24%
Purchase Details
Closed on
Mar 5, 2002
Sold by
Falcon Joe L and Falcon Teri
Bought by
Humberg Mario E and Humberg Tania R
Home Financials for this Owner
Home Financials are based on the most recent Mortgage that was taken out on this home.
Original Mortgage
$206,550
Interest Rate
6.98%
Purchase Details
Closed on
Aug 1, 1995
Sold by
Scott Steven M
Bought by
Southern Built Homes Inc
Purchase Details
Closed on
Aug 24, 1994
Sold by
Haynes Larry N
Bought by
Scott Steven M
Create a Home Valuation Report for This Property
The Home Valuation Report is an in-depth analysis detailing your home's value as well as a comparison with similar homes in the area
Home Values in the Area
Average Home Value in this Area
Purchase History
| Date | Buyer | Sale Price | Title Company |
|---|---|---|---|
| Vick Robert L | $239,500 | -- | |
| Humberg Mario E | $229,500 | -- | |
| Southern Built Homes Inc | $31,500 | -- | |
| Scott Steven M | -- | -- |
Source: Public Records
Mortgage History
| Date | Status | Borrower | Loan Amount |
|---|---|---|---|
| Closed | Scott Steven M | $123,000 | |
| Previous Owner | Scott Steven M | $206,550 |
Source: Public Records
Tax History Compared to Growth
Tax History
| Year | Tax Paid | Tax Assessment Tax Assessment Total Assessment is a certain percentage of the fair market value that is determined by local assessors to be the total taxable value of land and additions on the property. | Land | Improvement |
|---|---|---|---|---|
| 2025 | $3,266 | $115,425 | $16,250 | $99,175 |
| 2024 | $3,266 | $115,425 | $16,250 | $99,175 |
| 2023 | $2,166 | $115,425 | $16,250 | $99,175 |
| 2022 | $1,865 | $115,425 | $16,250 | $99,175 |
| 2021 | $1,707 | $76,900 | $12,500 | $64,400 |
| 2020 | $1,707 | $76,900 | $12,500 | $64,400 |
| 2019 | $1,707 | $76,900 | $12,500 | $64,400 |
| 2018 | $2,344 | $76,900 | $0 | $0 |
| 2017 | $2,731 | $70,275 | $0 | $0 |
| 2016 | $2,731 | $70,275 | $0 | $0 |
| 2015 | $2,731 | $70,275 | $0 | $0 |
| 2014 | $1,748 | $70,275 | $0 | $0 |
| 2013 | -- | $69,325 | $0 | $0 |
Source: Public Records
Map
Nearby Homes
- 3289 Siegel Rd
- 3411 John Richards Dr
- 3505 John Richards Dr
- 3435 John Richards Dr
- 3431 John Richards Dr
- 3429 John Richards Dr
- 3425 John Richards Dr
- 3423 John Richards Dr
- 3417 John Richards Dr
- 3419 John Richards Dr
- 3407 John Richards Dr
- 2923 Regenwood Dr
- 723 Regal Dr
- 3502 Winterfell Dr
- 3434 Magruder Dr
- 3131 Park Hill Rd
- 2910 Chaucer Dr
- 3508 Pershing Dr
- 3535 Caroline Farms Dr
- 3524 Magruder Dr