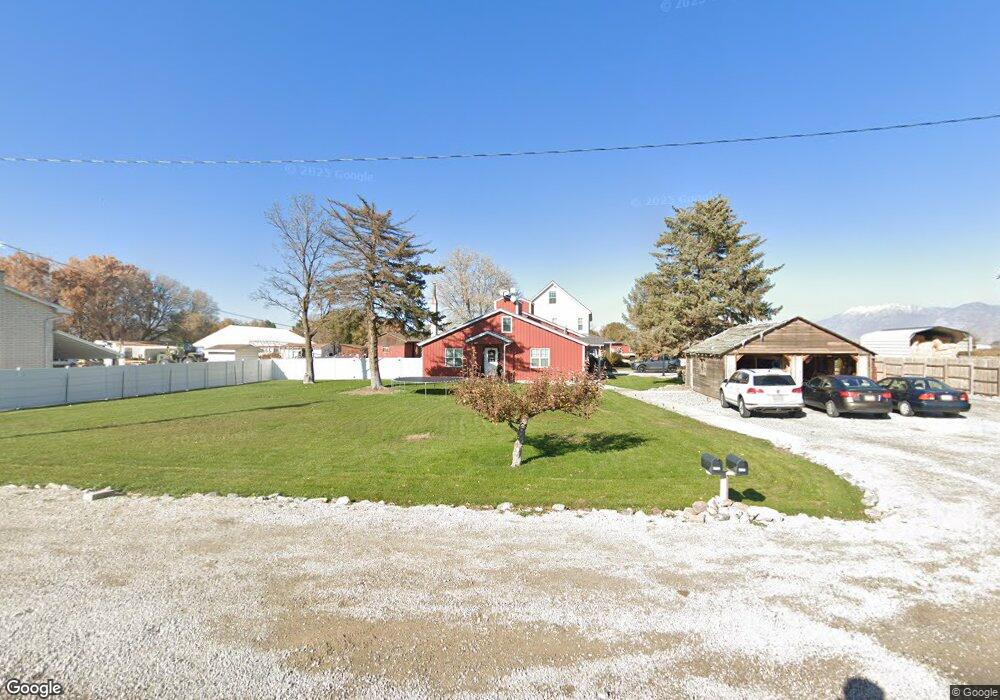
3122 W 7800 S Spanish Fork, UT 84660
Estimated Value: $1,014,000 - $1,563,635
4
Beds
1
Bath
2,165
Sq Ft
$595/Sq Ft
Est. Value
About This Home
This home is located at 3122 W 7800 S, Spanish Fork, UT 84660 and is currently estimated at $1,288,818, approximately $595 per square foot. 3122 W 7800 S is a home located in Utah County with nearby schools including Brockbank Elementary School, Spanish Fork Jr High School, and Spanish Fork High School.
Ownership History
Date
Name
Owned For
Owner Type
Purchase Details
Closed on
Jul 18, 2013
Sold by
Stewart Justin
Bought by
Stewart Justin J and Stewart Jill
Current Estimated Value
Home Financials for this Owner
Home Financials are based on the most recent Mortgage that was taken out on this home.
Original Mortgage
$331,500
Outstanding Balance
$240,641
Interest Rate
3.88%
Mortgage Type
New Conventional
Estimated Equity
$1,048,177
Purchase Details
Closed on
Aug 29, 2012
Sold by
Stewart Justin
Bought by
Stewart Justin
Purchase Details
Closed on
May 22, 2012
Sold by
Pritchett Kevin
Bought by
Stewart Justin
Home Financials for this Owner
Home Financials are based on the most recent Mortgage that was taken out on this home.
Original Mortgage
$73,710
Interest Rate
3.85%
Mortgage Type
Purchase Money Mortgage
Create a Home Valuation Report for This Property
The Home Valuation Report is an in-depth analysis detailing your home's value as well as a comparison with similar homes in the area
Purchase History
| Date | Buyer | Sale Price | Title Company |
|---|---|---|---|
| Stewart Justin J | -- | Titel One | |
| Stewart Justin | -- | Title West | |
| Stewart Justin | -- | None Available |
Source: Public Records
Mortgage History
| Date | Status | Borrower | Loan Amount |
|---|---|---|---|
| Open | Stewart Justin J | $331,500 | |
| Previous Owner | Stewart Justin | $73,710 |
Source: Public Records
Tax History
| Year | Tax Paid | Tax Assessment Tax Assessment Total Assessment is a certain percentage of the fair market value that is determined by local assessors to be the total taxable value of land and additions on the property. | Land | Improvement |
|---|---|---|---|---|
| 2025 | $5,875 | $580,555 | -- | -- |
| 2024 | $5,875 | $582,945 | $0 | $0 |
| 2023 | $6,215 | $617,155 | $0 | $0 |
| 2022 | $5,588 | $899,100 | $298,900 | $600,200 |
| 2021 | $4,737 | $666,800 | $215,500 | $451,300 |
| 2020 | $4,625 | $634,800 | $183,500 | $451,300 |
| 2019 | $4,211 | $601,100 | $149,800 | $451,300 |
| 2018 | $3,990 | $541,500 | $129,800 | $411,700 |
| 2017 | $3,510 | $269,755 | $0 | $0 |
| 2016 | $3,535 | $263,210 | $0 | $0 |
| 2015 | $3,380 | $249,515 | $0 | $0 |
| 2014 | $3,184 | $235,270 | $0 | $0 |
Source: Public Records
Map
Nearby Homes
- 7702 S 3300 W
- 2968 W 7300 S
- 6668 S 3200 W
- 6612 S 3200 W
- 1544 E 920 N
- 1544 E 920 N Unit 192
- 1782 N 1240 E
- 1729 N 1280 E
- 1279 E 1670 N
- 1282 1700 N
- 1296 E 1670 N
- 1304 E 1670 N
- 1304 E 1670 N Unit 907
- 1339 E 1670 N Unit 818
- 1339 E 1670 N
- 1302 E 1670 N Unit 908
- 1302 E 1670 N
- 1338 E 1670 N
- 1338 E 1670 N Unit 820
- 1301 E 1670 N
Your Personal Tour Guide
Ask me questions while you tour the home.