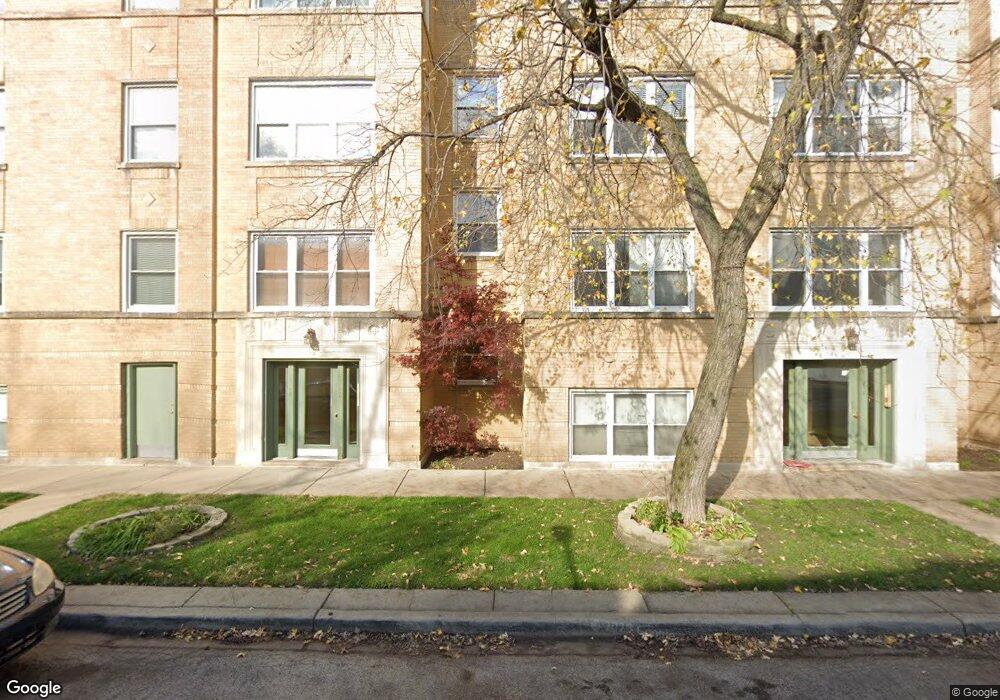
3122 W Cullom Ave Unit 31222 Chicago, IL 60618
Irving Park NeighborhoodEstimated Value: $311,000 - $345,000
--
Bed
--
Bath
--
Sq Ft
0.36
Acres
About This Home
This home is located at 3122 W Cullom Ave Unit 31222, Chicago, IL 60618 and is currently estimated at $326,701. 3122 W Cullom Ave Unit 31222 is a home located in Cook County with nearby schools including Bateman Elementary School and Roosevelt High School.
Ownership History
Date
Name
Owned For
Owner Type
Purchase Details
Closed on
Aug 13, 2021
Sold by
Charles Jill A
Bought by
Olena Eden and Singer Jacob M
Current Estimated Value
Home Financials for this Owner
Home Financials are based on the most recent Mortgage that was taken out on this home.
Original Mortgage
$229,900
Outstanding Balance
$208,599
Interest Rate
2.9%
Mortgage Type
New Conventional
Estimated Equity
$118,102
Purchase Details
Closed on
May 26, 2011
Sold by
Dykeman Steven
Bought by
Charles Jill A
Home Financials for this Owner
Home Financials are based on the most recent Mortgage that was taken out on this home.
Original Mortgage
$90,000
Interest Rate
4.81%
Mortgage Type
New Conventional
Purchase Details
Closed on
Mar 21, 2002
Sold by
Troy/Cullom Llc
Bought by
Dykeman Steven
Home Financials for this Owner
Home Financials are based on the most recent Mortgage that was taken out on this home.
Original Mortgage
$213,650
Interest Rate
6.87%
Create a Home Valuation Report for This Property
The Home Valuation Report is an in-depth analysis detailing your home's value as well as a comparison with similar homes in the area
Home Values in the Area
Average Home Value in this Area
Purchase History
| Date | Buyer | Sale Price | Title Company |
|---|---|---|---|
| Olena Eden | $242,000 | Alliance Title Corporation | |
| Charles Jill A | $100,000 | Saturn Title | |
| Dykeman Steven | $225,000 | -- |
Source: Public Records
Mortgage History
| Date | Status | Borrower | Loan Amount |
|---|---|---|---|
| Open | Olena Eden | $229,900 | |
| Previous Owner | Charles Jill A | $90,000 | |
| Previous Owner | Dykeman Steven | $213,650 |
Source: Public Records
Tax History Compared to Growth
Tax History
| Year | Tax Paid | Tax Assessment Tax Assessment Total Assessment is a certain percentage of the fair market value that is determined by local assessors to be the total taxable value of land and additions on the property. | Land | Improvement |
|---|---|---|---|---|
| 2024 | $4,235 | $22,187 | $3,420 | $18,767 |
| 2023 | $4,128 | $20,000 | $2,758 | $17,242 |
| 2022 | $4,128 | $20,000 | $2,758 | $17,242 |
| 2021 | $3,363 | $19,999 | $2,757 | $17,242 |
| 2020 | $2,811 | $15,678 | $1,213 | $14,465 |
| 2019 | $2,828 | $17,458 | $1,213 | $16,245 |
| 2018 | $2,779 | $17,458 | $1,213 | $16,245 |
| 2017 | $771 | $6,946 | $1,103 | $5,843 |
| 2016 | $894 | $6,946 | $1,103 | $5,843 |
| 2015 | $795 | $6,946 | $1,103 | $5,843 |
| 2014 | $1,940 | $12,988 | $992 | $11,996 |
| 2013 | $1,891 | $12,988 | $992 | $11,996 |
Source: Public Records
Map
Nearby Homes
- 4307 N Troy St Unit 1
- 4333 N Troy St Unit 3E
- 4231 N Kedzie Ave Unit 3E
- 4410 N Troy St Unit 101
- 3102 W Berteau Ave Unit 31023
- 4248 N Sawyer Ave
- 4141 N Kedzie Ave Unit 307
- 4438 N Kedzie Ave Unit G-1
- 4343 N Sacramento Ave Unit A-G
- 4437 N Whipple St
- 4411 N Sacramento Ave Unit 1
- 3055 W Sunnyside Ave Unit 1
- 3247 W Berteau Ave
- 4347 N Richmond St Unit 2N
- 4347 N Richmond St Unit 3N
- 4116 N Kedzie Ave
- 4425 N Sacramento Ave
- 4148 N Richmond St
- 4438 N Spaulding Ave
- 3223 W Belle Plaine Ave
- 3114 W Cullom Ave Unit 1
- 4309 N Troy St Unit PU4
- 3114 W Cullom Ave Unit 31143
- 3114 W Cullom Ave Unit 31141
- 4301 N Troy St Unit 43012
- 4309 N Troy St Unit 43093
- 4309 N Troy St Unit PU9
- 4309 N Troy St Unit PU2
- 4309 N Troy St Unit PU1
- 4301 N Troy St Unit 43013
- 4301 N Troy St Unit 4301G
- 3124 W Cullom Ave Unit 31243
- 4309 N Troy St Unit 43091
- 3124 W Cullom Ave Unit 31242
- 3114 W Cullom Ave Unit 31142
- 3122 W Cullom Ave Unit 31223
- 3122 W Cullom Ave Unit 31221
- 4301 N Troy St Unit 43011
- 3124 W Cullom Ave Unit 31241
- 4309 N Troy St Unit PU3