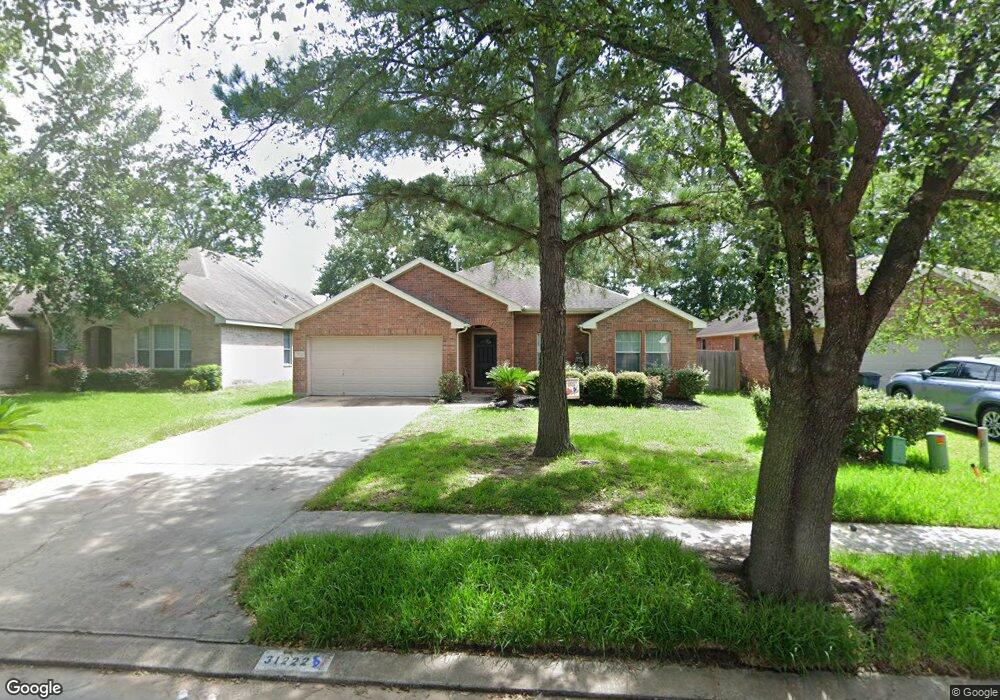
31222 Windcrest Park Ln Spring, TX 77386
Imperial Oaks NeighborhoodEstimated Value: $314,824 - $413,000
--
Bed
--
Bath
2,184
Sq Ft
$171/Sq Ft
Est. Value
About This Home
This home is located at 31222 Windcrest Park Ln, Spring, TX 77386 and is currently estimated at $372,706, approximately $170 per square foot. 31222 Windcrest Park Ln is a home located in Montgomery County with nearby schools including Kaufman Elementary School, Vogel Intermediate School, and Irons J High School.
Ownership History
Date
Name
Owned For
Owner Type
Purchase Details
Closed on
Feb 24, 2009
Sold by
Shotwell Sherlyn
Bought by
Norris Ronald L
Current Estimated Value
Home Financials for this Owner
Home Financials are based on the most recent Mortgage that was taken out on this home.
Original Mortgage
$153,075
Outstanding Balance
$96,246
Interest Rate
4.92%
Mortgage Type
FHA
Estimated Equity
$276,460
Purchase Details
Closed on
Dec 31, 2003
Sold by
Weekley Homes Lp
Bought by
Norris Ronald
Home Financials for this Owner
Home Financials are based on the most recent Mortgage that was taken out on this home.
Original Mortgage
$110,400
Interest Rate
5.12%
Mortgage Type
Purchase Money Mortgage
Purchase Details
Closed on
Sep 8, 2003
Sold by
Imperial Oaks No 3 Ltd
Bought by
Norris Ronald
Create a Home Valuation Report for This Property
The Home Valuation Report is an in-depth analysis detailing your home's value as well as a comparison with similar homes in the area
Home Values in the Area
Average Home Value in this Area
Purchase History
| Date | Buyer | Sale Price | Title Company |
|---|---|---|---|
| Norris Ronald L | -- | Great American Title | |
| Norris Ronald | -- | -- | |
| Shotwell Sherlyn | -- | Priority Title Company | |
| Norris Ronald | -- | -- |
Source: Public Records
Mortgage History
| Date | Status | Borrower | Loan Amount |
|---|---|---|---|
| Open | Norris Ronald L | $153,075 | |
| Previous Owner | Shotwell Sherlyn | $110,400 |
Source: Public Records
Tax History Compared to Growth
Tax History
| Year | Tax Paid | Tax Assessment Tax Assessment Total Assessment is a certain percentage of the fair market value that is determined by local assessors to be the total taxable value of land and additions on the property. | Land | Improvement |
|---|---|---|---|---|
| 2025 | $5,173 | $315,701 | -- | -- |
| 2024 | $4,731 | $287,001 | -- | -- |
| 2023 | $4,731 | $260,910 | $68,000 | $234,500 |
| 2022 | $6,060 | $237,190 | $25,000 | $257,260 |
| 2021 | $5,957 | $215,630 | $25,000 | $190,630 |
| 2020 | $6,122 | $212,270 | $25,000 | $187,270 |
| 2019 | $6,377 | $215,110 | $25,000 | $190,110 |
| 2018 | $5,344 | $202,620 | $25,000 | $177,620 |
| 2017 | $6,041 | $202,620 | $25,000 | $177,620 |
| 2016 | $5,876 | $197,060 | $25,000 | $172,060 |
| 2015 | $4,844 | $185,590 | $25,000 | $168,650 |
| 2014 | $4,844 | $168,720 | $25,000 | $155,890 |
Source: Public Records
Map
Nearby Homes
- 31214 Windcrest Park Ln
- 31235 Windcrest Park Ln
- 2526 Hidden Park Ln
- 2618 Bridgestone Park Ln
- 31419 Fountainbrook Park Ln
- 31602 Forest Oak Park Ct
- 31030 S Imperial Path Ln
- 32331 Summer Park Ln
- 32315 Golden Oak Park Ln
- 2047 Copperwood Park Ln
- 2143 Westover Park Cir
- 32319 Archer Park
- 32364 Mossy Pine Way
- 2614 Winding Creek Way
- 31002 Deerwood Park Ln
- 2611 Winding Creek Way
- 31815 Forest Oak Ln
- 31810 Forest Oak Ln
- 2954 Smokey Forest Ln
- 3002 Rusty Bridge Ct
- 31226 Windcrest Park Ln
- 31218 Windcrest Park Ln
- 31219 Rainwood Park Ln
- 31230 Windcrest Park Ln
- 31223 Rainwood Park Ln
- 31211 Rainwood Park Ln
- 31227 Rainwood Park Ln
- 31227 Windcrest Park Ln
- 31223 Windcrest Park Ln
- 31210 Windcrest Park Ln
- 31231 Windcrest Park Ln
- 31219 Windcrest Park Ln
- 31207 Rainwood Park Ln
- 31206 Windcrest Park Ln
- 31215 Windcrest Park Ln
- 2511 Hilldale Park Ln
- 2507 Hilldale Park Ln
- 2515 Hilldale Park Ln
- 31239 Windcrest Park Ln
- 31211 Windcrest Park Ln