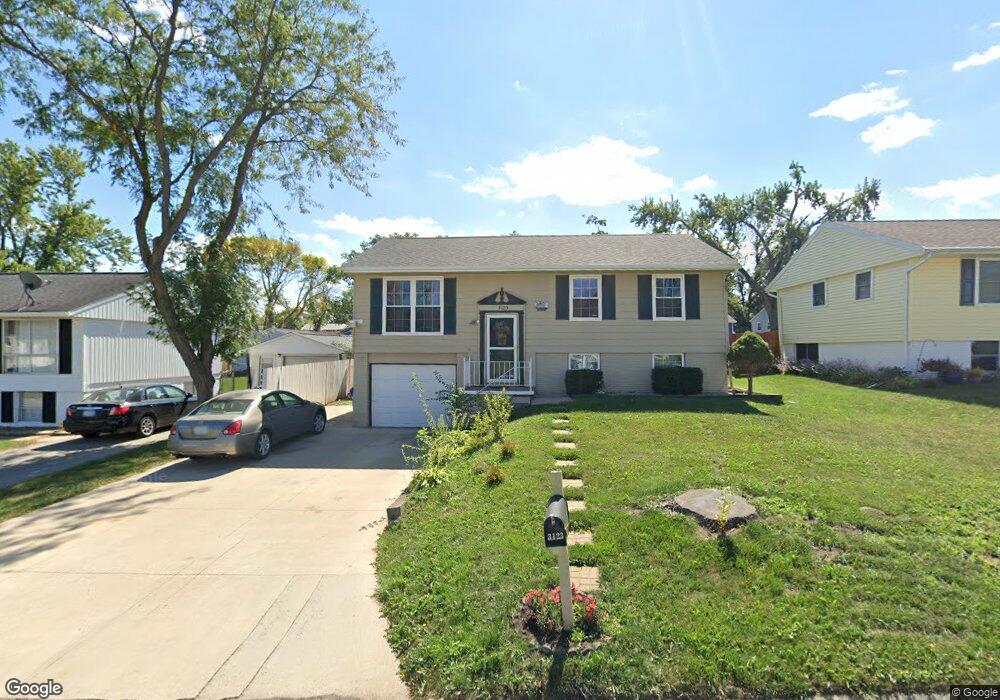
3123 Pebble Dr SW Cedar Rapids, IA 52404
Estimated Value: $190,543 - $214,000
3
Beds
2
Baths
894
Sq Ft
$223/Sq Ft
Est. Value
About This Home
This home is located at 3123 Pebble Dr SW, Cedar Rapids, IA 52404 and is currently estimated at $199,386, approximately $223 per square foot. 3123 Pebble Dr SW is a home located in Linn County with nearby schools including Prairie Crest Elementary School, Prairie View Elementary School, and Prairie Ridge Elementary School.
Ownership History
Date
Name
Owned For
Owner Type
Purchase Details
Closed on
Sep 16, 2006
Sold by
Bates Bruce and Bates Melissa
Bought by
Garcia Ramirez Jose I Loera and Garcia De Loera Maria Christina
Current Estimated Value
Home Financials for this Owner
Home Financials are based on the most recent Mortgage that was taken out on this home.
Original Mortgage
$91,200
Outstanding Balance
$54,500
Interest Rate
6.58%
Mortgage Type
Unknown
Estimated Equity
$144,886
Purchase Details
Closed on
Apr 26, 2002
Sold by
Freeberg Brian A and Freeberg Traci L
Bought by
Bates Bruce and Bates Melissa
Home Financials for this Owner
Home Financials are based on the most recent Mortgage that was taken out on this home.
Original Mortgage
$99,400
Interest Rate
7.13%
Purchase Details
Closed on
Oct 16, 1997
Sold by
Johnston Thomas J and Johnston Becky S
Bought by
Freeberg Brian A and Freeberg Traci L
Home Financials for this Owner
Home Financials are based on the most recent Mortgage that was taken out on this home.
Original Mortgage
$83,125
Interest Rate
7.65%
Create a Home Valuation Report for This Property
The Home Valuation Report is an in-depth analysis detailing your home's value as well as a comparison with similar homes in the area
Home Values in the Area
Average Home Value in this Area
Purchase History
| Date | Buyer | Sale Price | Title Company |
|---|---|---|---|
| Garcia Ramirez Jose I Loera | $113,500 | None Available | |
| Bates Bruce | $102,000 | -- | |
| Freeberg Brian A | $87,000 | -- |
Source: Public Records
Mortgage History
| Date | Status | Borrower | Loan Amount |
|---|---|---|---|
| Open | Garcia Ramirez Jose I Loera | $91,200 | |
| Previous Owner | Bates Bruce | $99,400 | |
| Previous Owner | Freeberg Brian A | $83,125 |
Source: Public Records
Tax History Compared to Growth
Tax History
| Year | Tax Paid | Tax Assessment Tax Assessment Total Assessment is a certain percentage of the fair market value that is determined by local assessors to be the total taxable value of land and additions on the property. | Land | Improvement |
|---|---|---|---|---|
| 2025 | $3,054 | $179,600 | $34,000 | $145,600 |
| 2024 | $3,228 | $174,400 | $31,200 | $143,200 |
| 2023 | $3,228 | $171,600 | $31,200 | $140,400 |
| 2022 | $2,774 | $154,600 | $25,800 | $128,800 |
| 2021 | $2,728 | $136,600 | $25,800 | $110,800 |
| 2020 | $2,728 | $128,400 | $23,100 | $105,300 |
| 2019 | $2,614 | $125,100 | $23,100 | $102,000 |
| 2018 | $2,538 | $125,100 | $23,100 | $102,000 |
| 2017 | $2,537 | $124,000 | $23,100 | $100,900 |
| 2016 | $2,537 | $117,200 | $23,100 | $94,100 |
| 2015 | $2,517 | $117,010 | $23,086 | $93,924 |
| 2014 | $2,330 | $121,954 | $23,086 | $98,868 |
| 2013 | $2,312 | $121,954 | $23,086 | $98,868 |
Source: Public Records
Map
Nearby Homes
- 3132 Pebble Dr SW
- 3009 Carriage Dr SW
- 3108 Huxley Ln SW
- 3226 Bramble Rd SW
- 2812 29th Ave SW
- 3221 Bramble Rd SW
- 3205 33rd Ave SW
- 3405 Queen Dr SW
- 3619 King Dr SW
- 3715 33rd Ave SW Unit 4.8 AC
- 3715 33rd Ave SW Unit 5.8 AC
- 3715 33rd Ave SW Unit 1 AC
- 2521 Radcliffe Ct SW
- 3302 Sokol Ln SW
- 3737 Monarch Dr SW
- 3406 Sokol Ln SW
- 3315 Sokol Ln SW
- 3321 Sokol Ln SW
- 3424 Sokol Ln SW
- 3212 Wilson Ave SW
- 3127 Pebble Dr SW
- 3119 Pebble Dr SW
- 3122 Bayberry Dr SW
- 3131 Pebble Dr SW
- 3115 Pebble Dr SW
- 3126 Bayberry Dr SW
- 3118 Bayberry Dr SW
- 3130 Bayberry Dr SW
- 3124 Pebble Dr SW
- 3120 Pebble Dr SW
- 3114 Bayberry Dr SW
- 3135 Pebble Dr SW
- 3128 Pebble Dr SW
- 3111 Pebble Dr SW
- 3116 Pebble Dr SW
- 3110 Bayberry Dr SW
- 3112 Pebble Dr SW
- 3139 Pebble Dr SW
- 3107 Pebble Dr SW
- 3138 Bayberry Dr SW