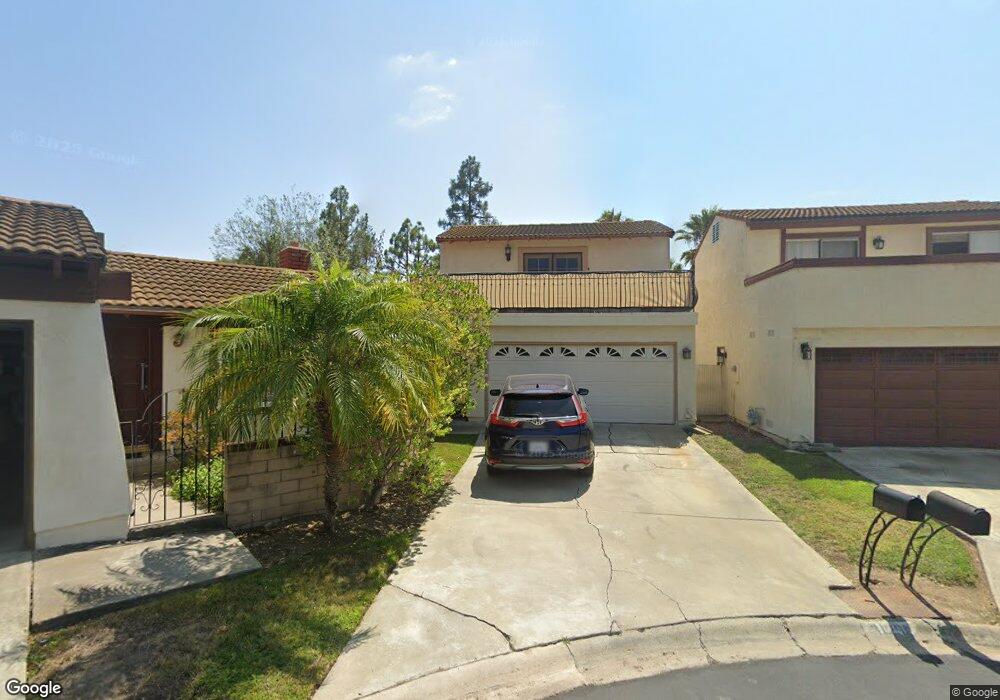
31231 Via San Vicente San Juan Capistrano, CA 92675
Estimated Value: $952,000 - $1,003,000
2
Beds
2
Baths
1,418
Sq Ft
$684/Sq Ft
Est. Value
About This Home
This home is located at 31231 Via San Vicente, San Juan Capistrano, CA 92675 and is currently estimated at $969,838, approximately $683 per square foot. 31231 Via San Vicente is a home located in Orange County with nearby schools including San Juan Elementary School, Marco Forster Middle School, and San Juan Hills High School.
Ownership History
Date
Name
Owned For
Owner Type
Purchase Details
Closed on
Jun 21, 2021
Sold by
Adair Roberts Margaret
Bought by
Margaret A Roberts Revocable Living Trust
Current Estimated Value
Purchase Details
Closed on
Dec 11, 2002
Sold by
Drolet Laree
Bought by
Roberts Margaret A and Margaret A Roberts Revocable Living Tr
Purchase Details
Closed on
May 15, 1998
Sold by
Execu Corp
Bought by
Drolet Laree
Home Financials for this Owner
Home Financials are based on the most recent Mortgage that was taken out on this home.
Original Mortgage
$164,000
Interest Rate
7.13%
Purchase Details
Closed on
Mar 12, 1998
Sold by
Anthony Stefaniuk
Bought by
Via San Vicente Trust #31231
Purchase Details
Closed on
Jan 21, 1993
Sold by
Hunt Robert Bruce and Kihano Hunt Carole Lita
Bought by
Stefaniuk Anthony
Create a Home Valuation Report for This Property
The Home Valuation Report is an in-depth analysis detailing your home's value as well as a comparison with similar homes in the area
Home Values in the Area
Average Home Value in this Area
Purchase History
| Date | Buyer | Sale Price | Title Company |
|---|---|---|---|
| Margaret A Roberts Revocable Living Trust | -- | -- | |
| Roberts Patrice M | -- | None Available | |
| Margaret A Roberts Revocable Living Trust | -- | -- | |
| Roberts Margaret A | $355,000 | Fidelity National Title | |
| Drolet Laree | $194,000 | Chicago Title Insurance Co | |
| Via San Vicente Trust #31231 | $138,336 | -- | |
| Stefaniuk Anthony | $184,000 | Old Republic Title |
Source: Public Records
Mortgage History
| Date | Status | Borrower | Loan Amount |
|---|---|---|---|
| Previous Owner | Drolet Laree | $164,000 |
Source: Public Records
Tax History Compared to Growth
Tax History
| Year | Tax Paid | Tax Assessment Tax Assessment Total Assessment is a certain percentage of the fair market value that is determined by local assessors to be the total taxable value of land and additions on the property. | Land | Improvement |
|---|---|---|---|---|
| 2025 | $5,528 | $511,973 | $392,612 | $119,361 |
| 2024 | $5,528 | $501,935 | $384,914 | $117,021 |
| 2023 | $5,355 | $492,094 | $377,367 | $114,727 |
| 2022 | $4,987 | $482,446 | $369,968 | $112,478 |
| 2021 | $4,896 | $472,987 | $362,714 | $110,273 |
| 2020 | $4,852 | $468,138 | $358,995 | $109,143 |
| 2019 | $4,763 | $458,959 | $351,956 | $107,003 |
| 2018 | $4,678 | $449,960 | $345,055 | $104,905 |
| 2017 | $4,635 | $441,138 | $338,289 | $102,849 |
| 2016 | $4,550 | $432,489 | $331,656 | $100,833 |
| 2015 | $4,480 | $425,993 | $326,674 | $99,319 |
| 2014 | $4,236 | $401,913 | $311,035 | $90,878 |
Source: Public Records
Map
Nearby Homes
- 31261 Paseo Olivos
- 31278 Calle San Juan Unit 12
- 31284 Calle San Juan Unit 14
- 31121 Via Santo Tomas
- 31377 Los Rios St Unit 64
- 26468 Calle San Antonio
- 26447 Paseo Carmel Unit 11D
- 31024 Calle San Diego Unit 94b
- 31608 Los Rios St Unit 147
- 30981 Via Mirador
- 27381 Via Priorato
- 30828 Calle Chueca
- 0 Aguacate Rd Unit 25558127
- 90 Plaza de Las Flores
- 70 Plaza Cuesta
- 31527 Aguacate Rd
- 30532 Marbella Vista
- 27594 Starrise Ln
- 32011 Via Tonada Unit 9
- 31980 Via Refrescar
- 31225 Via San Vicente
- 31235 Via San Vicente
- 31221 Via San Vicente
- 31242 Calle San Pedro
- 31272 Via San Vicente
- 31215 Via San Vicente
- 31236 Calle San Pedro
- 31266 Via San Vicente
- 31276 Via San Vicente
- 31222 Via San Vicente
- 31232 Calle San Pedro
- 31246 Calle San Pedro
- 31211 Via San Vicente
- 31262 Via San Vicente
- 31282 Via San Vicente
- 31226 Via San Vicente
- 31222 Calle San Pedro
- 31256 Via San Vicente
- 31282 Calle San Pedro
- 31205 Via San Vicente