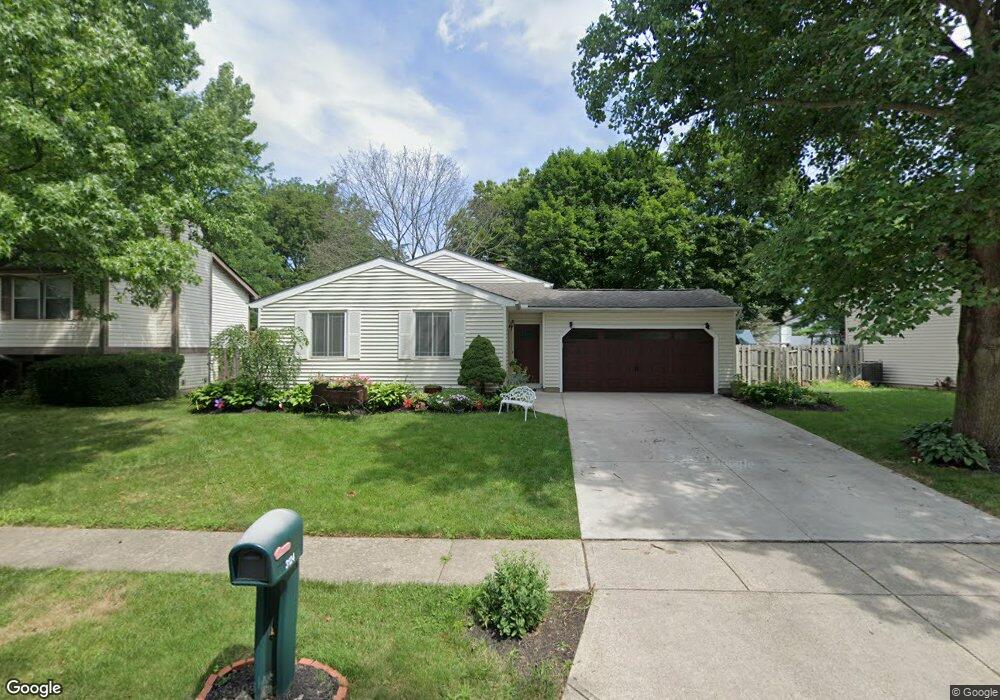
3124 Aullwood Ct Dublin, OH 43017
Riverside NeighborhoodEstimated Value: $351,000 - $399,000
3
Beds
3
Baths
1,586
Sq Ft
$236/Sq Ft
Est. Value
About This Home
This home is located at 3124 Aullwood Ct, Dublin, OH 43017 and is currently estimated at $373,663, approximately $235 per square foot. 3124 Aullwood Ct is a home located in Franklin County with nearby schools including Riverside Elementary School, Ann Simpson Davis Middle School, and Dublin Scioto High School.
Ownership History
Date
Name
Owned For
Owner Type
Purchase Details
Closed on
Oct 19, 2006
Sold by
Stubbs Dawn L
Bought by
Campa Juan
Current Estimated Value
Home Financials for this Owner
Home Financials are based on the most recent Mortgage that was taken out on this home.
Original Mortgage
$134,320
Outstanding Balance
$80,328
Interest Rate
6.5%
Mortgage Type
New Conventional
Estimated Equity
$293,335
Purchase Details
Closed on
Dec 30, 2002
Sold by
Keller Donald C and Keller Julie A
Bought by
Stubbs Dawn L
Home Financials for this Owner
Home Financials are based on the most recent Mortgage that was taken out on this home.
Original Mortgage
$141,050
Interest Rate
6.23%
Mortgage Type
Purchase Money Mortgage
Purchase Details
Closed on
Sep 29, 1986
Bought by
Keller Donald C and Keller Julie A
Purchase Details
Closed on
Apr 1, 1985
Create a Home Valuation Report for This Property
The Home Valuation Report is an in-depth analysis detailing your home's value as well as a comparison with similar homes in the area
Home Values in the Area
Average Home Value in this Area
Purchase History
| Date | Buyer | Sale Price | Title Company |
|---|---|---|---|
| Campa Juan | $167,900 | Title First | |
| Stubbs Dawn L | $148,500 | Real Living Title | |
| Keller Donald C | $77,000 | -- | |
| -- | $76,000 | -- |
Source: Public Records
Mortgage History
| Date | Status | Borrower | Loan Amount |
|---|---|---|---|
| Open | Campa Juan | $134,320 | |
| Previous Owner | Stubbs Dawn L | $141,050 |
Source: Public Records
Tax History Compared to Growth
Tax History
| Year | Tax Paid | Tax Assessment Tax Assessment Total Assessment is a certain percentage of the fair market value that is determined by local assessors to be the total taxable value of land and additions on the property. | Land | Improvement |
|---|---|---|---|---|
| 2024 | $6,118 | $101,160 | $34,270 | $66,890 |
| 2023 | $6,032 | $101,150 | $34,265 | $66,885 |
| 2022 | $4,705 | $73,330 | $25,060 | $48,270 |
| 2021 | $4,782 | $73,330 | $25,060 | $48,270 |
| 2020 | $4,753 | $73,330 | $25,060 | $48,270 |
| 2019 | $4,131 | $56,430 | $19,290 | $37,140 |
| 2018 | $4,014 | $56,430 | $19,290 | $37,140 |
| 2017 | $3,835 | $56,430 | $19,290 | $37,140 |
| 2016 | $3,856 | $53,590 | $13,860 | $39,730 |
| 2015 | $3,880 | $53,590 | $13,860 | $39,730 |
| 2014 | $3,884 | $53,590 | $13,860 | $39,730 |
| 2013 | $1,878 | $51,030 | $13,195 | $37,835 |
Source: Public Records
Map
Nearby Homes
- 3107 Hamden Ct
- 3185 Middleboro Way
- 6354 Emberwood Rd
- 2947 Talbrock Cir
- 2951 Cranston Dr Unit 2953
- 6342 Bannister Dr
- 3087 Strathaven Ct
- 3263 Scioto Ridge Rd
- 2960 Sawdust Ln Unit 2960
- 2946 Sawdust Ln
- 6241 Buck Ridge Rd
- 6040 Thatcher Dr
- 5622 Riverside Dr
- 2970 Black Kettle Trail
- 6802 Chesley Rd
- 6841 Riverside Glen Ct
- 5850 Meadowhurst Way
- 3370 Kendelmarie Way
- 3002 Glenloch Cir Unit 3002
- 5753 Newgate Rd Unit 5753
- 3132 Aullwood Ct
- 3116 Aullwood Ct
- 3123 Wakeshire Dr
- 6348 Amston Dr
- 3131 Wakeshire Dr
- 3115 Wakeshire Dr
- 3108 Aullwood Ct
- 3107 Wakeshire Dr
- 3125 Aullwood Ct
- 3139 Wakeshire Dr
- 3133 Aullwood Ct
- 3117 Aullwood Ct
- 3099 Wakeshire Dr
- 6320 Amston Dr
- 3100 Aullwood Ct
- 3109 Aullwood Ct
- 3091 Wakeshire Dr
- 3101 Aullwood Ct
- 3122 Wakeshire Dr
- 6343 Amston Dr