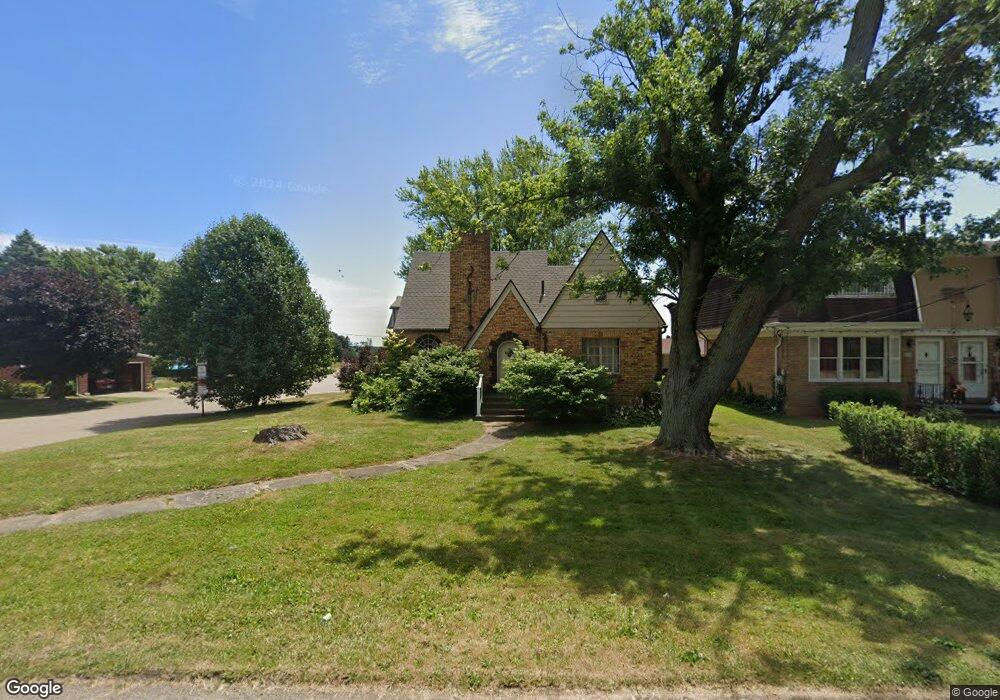
3124 Martindale Rd NE Canton, OH 44714
Plain Township NeighborhoodEstimated Value: $157,000 - $190,000
4
Beds
2
Baths
1,769
Sq Ft
$101/Sq Ft
Est. Value
About This Home
This home is located at 3124 Martindale Rd NE, Canton, OH 44714 and is currently estimated at $179,205, approximately $101 per square foot. 3124 Martindale Rd NE is a home located in Stark County with nearby schools including Frazer Elementary School, Glenwood Intermediate School, and GlenOak High School.
Ownership History
Date
Name
Owned For
Owner Type
Purchase Details
Closed on
Mar 31, 2009
Sold by
Adkins Harlen and Adkins Karen L
Bought by
Adkins Harlen C and Adkins Karen L
Current Estimated Value
Purchase Details
Closed on
Jan 27, 2009
Sold by
Deutsche Bank National Trust Company
Bought by
Adkins Harlen
Purchase Details
Closed on
Sep 29, 2008
Sold by
Meola Carol L and Meola Michael R
Bought by
Deutsche Bank National Trust Company
Purchase Details
Closed on
Nov 20, 2007
Sold by
Meola Michael R
Bought by
Meola Carol L
Purchase Details
Closed on
Sep 18, 1995
Sold by
Lijoi Marianna
Bought by
Meola Michael R and Meola Carol
Home Financials for this Owner
Home Financials are based on the most recent Mortgage that was taken out on this home.
Original Mortgage
$75,900
Interest Rate
7.81%
Mortgage Type
New Conventional
Create a Home Valuation Report for This Property
The Home Valuation Report is an in-depth analysis detailing your home's value as well as a comparison with similar homes in the area
Home Values in the Area
Average Home Value in this Area
Purchase History
| Date | Buyer | Sale Price | Title Company |
|---|---|---|---|
| Adkins Harlen C | -- | Attorney | |
| Adkins Harlen | $60,000 | Attorney | |
| Deutsche Bank National Trust Company | $80,000 | None Available | |
| Meola Carol L | -- | Attorney | |
| Meola Michael R | $79,900 | -- |
Source: Public Records
Mortgage History
| Date | Status | Borrower | Loan Amount |
|---|---|---|---|
| Previous Owner | Meola Michael R | $75,900 |
Source: Public Records
Tax History Compared to Growth
Tax History
| Year | Tax Paid | Tax Assessment Tax Assessment Total Assessment is a certain percentage of the fair market value that is determined by local assessors to be the total taxable value of land and additions on the property. | Land | Improvement |
|---|---|---|---|---|
| 2025 | $101 | $47,110 | $12,460 | $34,650 |
| 2024 | $43 | $47,110 | $12,460 | $34,650 |
| 2023 | $1,617 | $33,010 | $8,260 | $24,750 |
| 2022 | $1,583 | $33,010 | $8,260 | $24,750 |
| 2021 | $1,590 | $33,010 | $8,260 | $24,750 |
| 2020 | $1,553 | $29,300 | $7,140 | $22,160 |
| 2019 | $1,541 | $29,300 | $7,140 | $22,160 |
| 2018 | $1,523 | $29,300 | $7,140 | $22,160 |
| 2017 | $1,341 | $23,670 | $7,320 | $16,350 |
| 2016 | $1,344 | $23,670 | $7,320 | $16,350 |
| 2015 | $930 | $23,670 | $7,320 | $16,350 |
| 2014 | $1,354 | $24,090 | $7,460 | $16,630 |
| 2013 | $662 | $24,090 | $7,460 | $16,630 |
Source: Public Records
Map
Nearby Homes
- 3321 Martindale Rd NE
- 1000 Milford St NE
- 1306 Milford St NE
- 3619 Rowland Ave NE
- 142 36th St NE
- 1428 35th St NE
- 1117 28th St NE
- 233 31st St NW
- 1601 33rd St NE
- 123 28th St NE
- 0 St Elmo Ave NE Unit 5159780
- 0 St Elmo Ave NE Unit 5089961
- 3122 Logan Ave NW
- 1115 Colonial Blvd NE
- 1644 33rd St NE
- 312 32nd St NW
- 1417 Colonial Blvd NE
- 1638 Warrick Place NE
- 3922 Market Ave N
- 1610 Colonial Blvd NE
- 3118 Martindale Rd NE
- 3204 Martindale Rd NE
- 3110 Martindale Rd NE
- 1026 32nd St NE
- 3210 Martindale Rd NE
- 3125 Martindale Rd NE
- 3119 Martindale Rd NE
- 1005 31st St NE
- 1101 32nd St NE
- 1102 32nd St NE
- 3209 Martindale Rd NE
- 1019 31st St NE
- 3214 Martindale Rd NE
- 3211 Martindale Rd NE
- 1111 32nd St NE
- 3220 Martindale Rd NE
- 3105 Martindale Rd NE
- 1110 32nd St NE
- 1105 31st St NE
- 3215 Martindale Rd NE