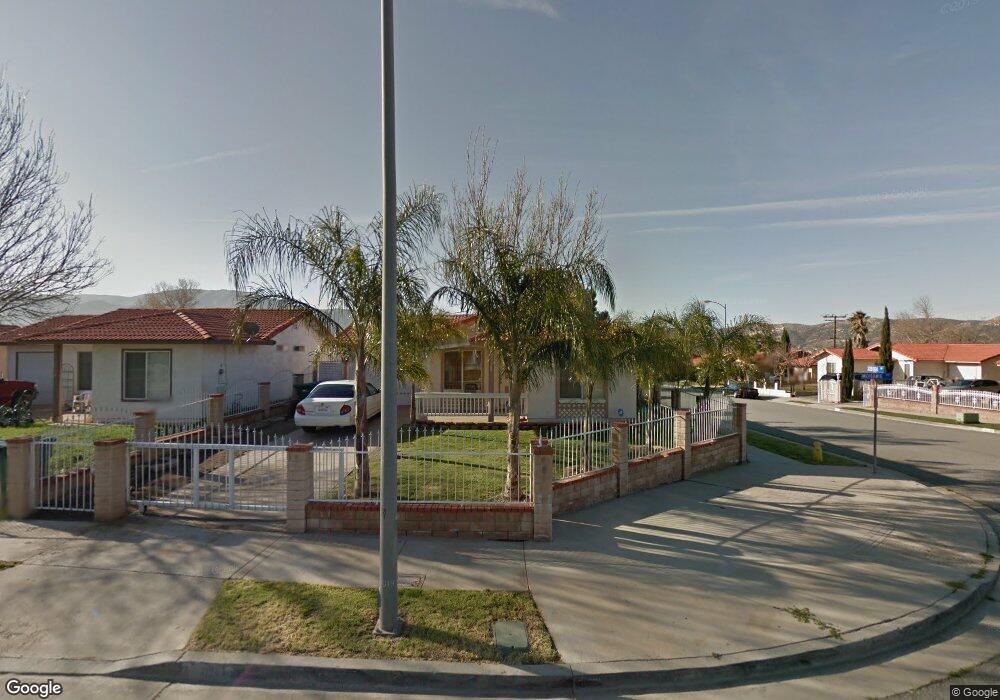
3124 Mohawk Rd Banning, CA 92220
Estimated Value: $301,000 - $409,000
2
Beds
2
Baths
984
Sq Ft
$337/Sq Ft
Est. Value
About This Home
This home is located at 3124 Mohawk Rd, Banning, CA 92220 and is currently estimated at $331,954, approximately $337 per square foot. 3124 Mohawk Rd is a home located in Riverside County with nearby schools including Banning High School, Young Scholar Education Center, and Calvary Christian School.
Ownership History
Date
Name
Owned For
Owner Type
Purchase Details
Closed on
Feb 3, 2015
Sold by
Cruz Onelia and Cruz Maricela
Bought by
Tobar Marcia
Current Estimated Value
Purchase Details
Closed on
Jan 25, 2007
Sold by
Cruz Onelia
Bought by
Cruz Onelia and Diaz Maria E
Purchase Details
Closed on
Aug 26, 1999
Sold by
Indymac Inc
Bought by
Cruz Mamerto R and Cruz Onelia
Home Financials for this Owner
Home Financials are based on the most recent Mortgage that was taken out on this home.
Original Mortgage
$40,287
Interest Rate
7.89%
Mortgage Type
FHA
Purchase Details
Closed on
Jun 25, 1999
Sold by
Chiang Dick
Bought by
Indymac Inc and Independent National Mtg Corp
Purchase Details
Closed on
Jul 12, 1995
Sold by
Banning Associates Lp
Bought by
Chiang Dick
Home Financials for this Owner
Home Financials are based on the most recent Mortgage that was taken out on this home.
Original Mortgage
$34,750
Interest Rate
8.62%
Create a Home Valuation Report for This Property
The Home Valuation Report is an in-depth analysis detailing your home's value as well as a comparison with similar homes in the area
Home Values in the Area
Average Home Value in this Area
Purchase History
| Date | Buyer | Sale Price | Title Company |
|---|---|---|---|
| Tobar Marcia | -- | None Available | |
| Cruz Onelia | -- | None Available | |
| Cruz Mamerto R | $40,000 | Lawyers Title Company | |
| Indymac Inc | $36,000 | Landsafe Title | |
| Chiang Dick | -- | Commonwealth Land Title Co |
Source: Public Records
Mortgage History
| Date | Status | Borrower | Loan Amount |
|---|---|---|---|
| Previous Owner | Cruz Mamerto R | $40,287 | |
| Previous Owner | Chiang Dick | $34,750 |
Source: Public Records
Tax History
| Year | Tax Paid | Tax Assessment Tax Assessment Total Assessment is a certain percentage of the fair market value that is determined by local assessors to be the total taxable value of land and additions on the property. | Land | Improvement |
|---|---|---|---|---|
| 2025 | $1,922 | $138,203 | $18,022 | $120,181 |
| 2023 | $1,922 | $132,838 | $17,323 | $115,515 |
| 2022 | $1,882 | $130,234 | $16,984 | $113,250 |
| 2021 | $1,846 | $127,681 | $16,651 | $111,030 |
| 2020 | $1,829 | $126,373 | $16,481 | $109,892 |
| 2019 | $1,801 | $123,896 | $16,158 | $107,738 |
| 2018 | $1,789 | $121,468 | $15,842 | $105,626 |
| 2017 | $1,759 | $119,087 | $15,532 | $103,555 |
| 2016 | $1,674 | $116,753 | $15,228 | $101,525 |
| 2015 | $761 | $51,006 | $12,779 | $38,227 |
| 2014 | $756 | $50,009 | $12,530 | $37,479 |
Source: Public Records
Map
Nearby Homes
- 2906 Summer Set Cir
- 733 Daybreak Way
- 699 Amber Sky St
- 492 Autumn Way
- 2880 Rainbow Ln
- 753 Amber Sky St
- 738 Amber Sky St
- 2694 Clear Ct
- 2648 Hazy Way
- 3138 W Nicolet St
- 259 S 22nd St
- 670 Morongo Ave
- 3800 W Jacinto View Rd
- 612 S 22nd St
- 3880 W Jacinto View Rd Unit D
- 3800 W Wilson St Unit 26
- 3800 W Wilson St Unit 41
- 3800 W Wilson St Unit 18
- 3800 W Wilson St Unit 394
- 3800 W Wilson St Unit 337
- 3112 Mohawk Rd
- 498 S Soboba Dr
- 0 Soboba Dr
- 3096 Mohawk Rd
- 481 S Soboba Dr
- 510 S Soboba Dr
- 469 S Soboba Dr
- 497 Cherokee Cir
- 3088 Mohawk Rd
- 491 S Soboba Dr
- 459 S Soboba Dr
- 3129 Mohawk Rd
- 3121 Mohawk Rd
- 507 Cherokee Cir
- 3137 Mohawk Rd
- 507 S Soboba Dr
- 3095 Mohawk Rd
- 447 S Soboba Dr
- 3145 Mohawk Rd
- 3078 Mohawk Rd
Your Personal Tour Guide
Ask me questions while you tour the home.