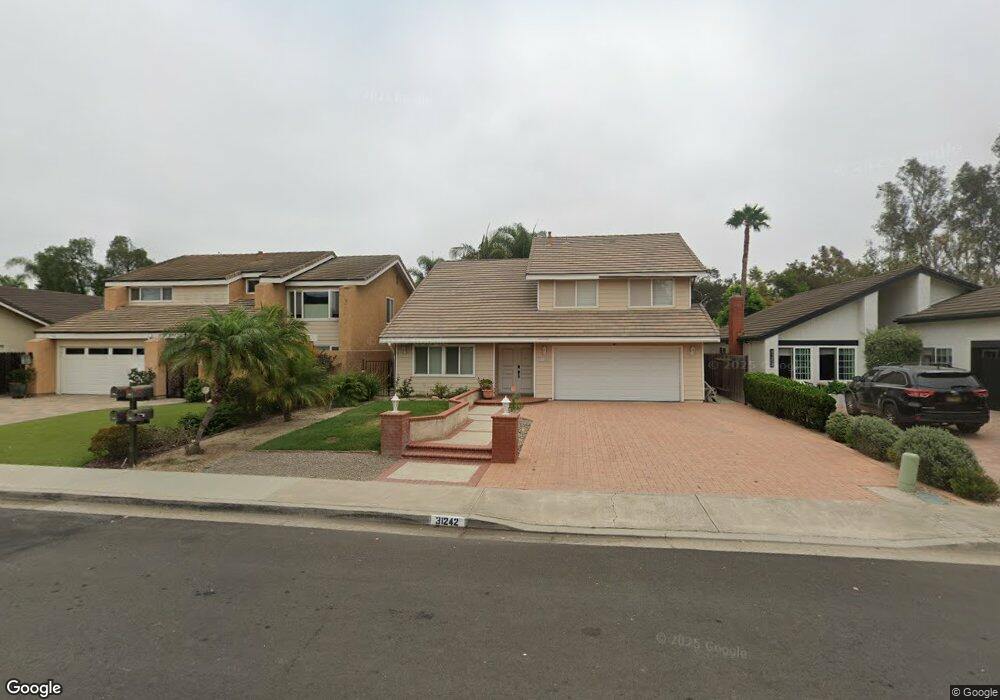
31242 Via Cordova San Juan Capistrano, CA 92675
Estimated Value: $1,454,000 - $1,630,542
3
Beds
3
Baths
2,458
Sq Ft
$643/Sq Ft
Est. Value
About This Home
This home is located at 31242 Via Cordova, San Juan Capistrano, CA 92675 and is currently estimated at $1,580,136, approximately $642 per square foot. 31242 Via Cordova is a home located in Orange County with nearby schools including Harold Ambuehl Elementary School, Marco Forster Middle School, and San Juan Hills High School.
Ownership History
Date
Name
Owned For
Owner Type
Purchase Details
Closed on
Jun 30, 1999
Sold by
Aparicio Caridad Victoria
Bought by
Aparicio Jorge
Current Estimated Value
Purchase Details
Closed on
Jun 15, 1999
Sold by
Carpenter Virginia
Bought by
Aparicio Jorge
Purchase Details
Closed on
Jun 4, 1999
Sold by
Levinson Steven Michael and Levinson Steven
Bought by
Aparicio Jorge
Purchase Details
Closed on
Jan 20, 1999
Sold by
Jorge Aparicio and Jorge Caridad V
Bought by
Aparicio Jorge Armando and Aparicio Caridad Victoria
Create a Home Valuation Report for This Property
The Home Valuation Report is an in-depth analysis detailing your home's value as well as a comparison with similar homes in the area
Home Values in the Area
Average Home Value in this Area
Purchase History
| Date | Buyer | Sale Price | Title Company |
|---|---|---|---|
| Aparicio Jorge | -- | Chicago Title Co | |
| Aparicio Jorge | $105,000 | Chicago Title Co | |
| Aparicio Jorge | $105,000 | Chicago Title Co | |
| Aparicio Jorge | $105,000 | Chicago Title Co | |
| Aparicio Jorge | $105,000 | Chicago Title Co | |
| Aparicio Jorge | $105,000 | Chicago Title Co | |
| Aparicio Jorge | $105,000 | Chicago Title Co | |
| Aparicio Jorge Armando | -- | -- |
Source: Public Records
Tax History Compared to Growth
Tax History
| Year | Tax Paid | Tax Assessment Tax Assessment Total Assessment is a certain percentage of the fair market value that is determined by local assessors to be the total taxable value of land and additions on the property. | Land | Improvement |
|---|---|---|---|---|
| 2025 | $3,740 | $419,214 | $99,410 | $319,804 |
| 2024 | $3,740 | $335,138 | $97,461 | $237,677 |
| 2023 | $3,603 | $328,567 | $95,550 | $233,017 |
| 2022 | $3,265 | $322,125 | $93,676 | $228,449 |
| 2021 | $3,203 | $315,809 | $91,839 | $223,970 |
| 2020 | $3,174 | $312,571 | $90,897 | $221,674 |
| 2019 | $3,114 | $306,443 | $89,115 | $217,328 |
| 2018 | $3,057 | $300,435 | $87,368 | $213,067 |
| 2017 | $3,028 | $294,545 | $85,655 | $208,890 |
| 2016 | $2,971 | $288,770 | $83,975 | $204,795 |
| 2015 | $2,924 | $284,433 | $82,714 | $201,719 |
| 2014 | $2,871 | $278,862 | $81,094 | $197,768 |
Source: Public Records
Map
Nearby Homes
- 31192 Via Cordova
- 30967 Steeplechase Dr
- 30932 Steeplechase Dr
- 31321 Via Las Palmas
- 27681 Paseo Esteban
- 28051 Calle Santa Ynez
- 27703 Ortega Hwy Unit 127
- 27703 Ortega Hwy Unit 13
- 10 Strawberry Ln
- 31062 Casa Grande Dr
- 28481 Avenida la Mancha
- 27591 Rolling Wood Ln
- 27782 Via Madrina
- 27821 Golden Ridge Ln
- 27972 Golden Ridge Ln
- 27281 Calle de la Rosa
- 27381 Via Priorato
- 31645 Rancho Viejo Rd
- 32055 Via Canela
- 30981 Via Mirador
- 31232 Via Cordova
- 31252 Via Cordova
- 31222 Via Cordova
- 31231 Via Solana
- 31241 Via Solana
- 31221 Via Solana
- 28091 Paseo Verde
- 31212 Via Cordova
- 31211 Via Solana
- 31221 Via Cordova
- 31202 Via Cordova
- 28085 Paseo Verde
- 28092 Paseo Verde
- 31211 Via Cordova
- 31201 Via Solana
- 28081 Paseo Verde
- 28082 Paseo Verde
- 28092 Paseo Ventura
- 28082 Paseo Ventura
- 31204 Via Solana