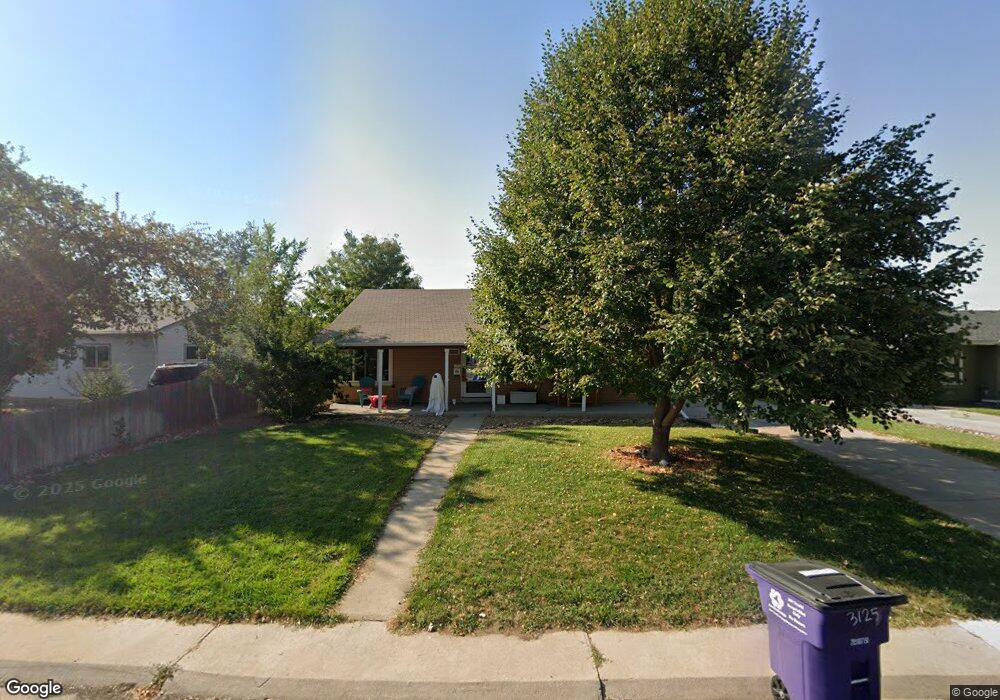
3125 S Grape Way Denver, CO 80222
University Hills NeighborhoodEstimated Value: $501,000 - $698,000
2
Beds
2
Baths
876
Sq Ft
$649/Sq Ft
Est. Value
About This Home
This home is located at 3125 S Grape Way, Denver, CO 80222 and is currently estimated at $568,605, approximately $649 per square foot. 3125 S Grape Way is a home located in Denver County with nearby schools including Bradley Elementary School, Hamilton Middle School, and Thomas Jefferson High School.
Ownership History
Date
Name
Owned For
Owner Type
Purchase Details
Closed on
Nov 21, 2013
Sold by
Nilan Eric and Willett Anne
Bought by
Nilan Eric and Nilan Anne
Current Estimated Value
Home Financials for this Owner
Home Financials are based on the most recent Mortgage that was taken out on this home.
Original Mortgage
$237,000
Outstanding Balance
$155,759
Interest Rate
4.34%
Mortgage Type
New Conventional
Estimated Equity
$412,846
Purchase Details
Closed on
May 27, 2009
Sold by
Scott Bryan H and Scott Brenda C
Bought by
Nilan Eric and Willett Anne
Home Financials for this Owner
Home Financials are based on the most recent Mortgage that was taken out on this home.
Original Mortgage
$256,715
Interest Rate
4.84%
Mortgage Type
FHA
Purchase Details
Closed on
Sep 25, 2007
Sold by
Palace Property Mgmt & Maintenance Inc
Bought by
Scott Bryan H and Scott Brenda C
Purchase Details
Closed on
Apr 25, 2007
Sold by
Countrywide Home Loans Inc
Bought by
Palace Property Mgmt & Maintenance Inc
Purchase Details
Closed on
Oct 4, 2006
Sold by
Melina Christine and Melina Jennifer
Bought by
Countrywide Home Loans Inc and Wells Fargo Harborview 2004-08
Purchase Details
Closed on
May 25, 2004
Sold by
Molina Jennifer
Bought by
Molina Jennifer and Molina Christine
Purchase Details
Closed on
Dec 3, 1999
Sold by
Lamanna Mary Kay
Bought by
Melina Jennifer
Home Financials for this Owner
Home Financials are based on the most recent Mortgage that was taken out on this home.
Original Mortgage
$155,829
Interest Rate
7.93%
Mortgage Type
FHA
Purchase Details
Closed on
Mar 18, 1998
Sold by
Flammini Mary Kay and Flammini Laura L
Bought by
Lamanna Mary Kay and Flammini Laura L
Home Financials for this Owner
Home Financials are based on the most recent Mortgage that was taken out on this home.
Original Mortgage
$105,000
Interest Rate
7.08%
Purchase Details
Closed on
Jun 20, 1996
Sold by
Anderson Vance B
Bought by
Flammini Mary Kay and Flammini Laura L
Home Financials for this Owner
Home Financials are based on the most recent Mortgage that was taken out on this home.
Original Mortgage
$104,500
Interest Rate
8.24%
Create a Home Valuation Report for This Property
The Home Valuation Report is an in-depth analysis detailing your home's value as well as a comparison with similar homes in the area
Home Values in the Area
Average Home Value in this Area
Purchase History
| Date | Buyer | Sale Price | Title Company |
|---|---|---|---|
| Nilan Eric | -- | Land Title Guarantee Company | |
| Nilan Eric | $261,500 | Unified Title Company | |
| Scott Bryan H | -- | None Available | |
| Scott Bryan H | -- | None Available | |
| Palace Property Mgmt & Maintenance Inc | $180,000 | None Available | |
| Countrywide Home Loans Inc | -- | None Available | |
| Molina Jennifer | -- | Chicago Title Co | |
| Melina Jennifer | $156,900 | Land Title | |
| Lamanna Mary Kay | -- | -- | |
| Flammini Mary Kay | $110,000 | -- |
Source: Public Records
Mortgage History
| Date | Status | Borrower | Loan Amount |
|---|---|---|---|
| Open | Nilan Eric | $237,000 | |
| Closed | Nilan Eric | $256,715 | |
| Previous Owner | Melina Jennifer | $155,829 | |
| Previous Owner | Lamanna Mary Kay | $105,000 | |
| Previous Owner | Flammini Mary Kay | $104,500 |
Source: Public Records
Tax History Compared to Growth
Tax History
| Year | Tax Paid | Tax Assessment Tax Assessment Total Assessment is a certain percentage of the fair market value that is determined by local assessors to be the total taxable value of land and additions on the property. | Land | Improvement |
|---|---|---|---|---|
| 2024 | $2,801 | $35,370 | $24,270 | $11,100 |
| 2023 | $2,741 | $35,370 | $24,270 | $11,100 |
| 2022 | $2,446 | $30,760 | $22,410 | $8,350 |
| 2021 | $2,362 | $31,650 | $23,060 | $8,590 |
| 2020 | $2,086 | $28,110 | $21,700 | $6,410 |
| 2019 | $2,027 | $28,110 | $21,700 | $6,410 |
| 2018 | $1,959 | $25,320 | $19,120 | $6,200 |
| 2017 | $1,953 | $25,320 | $19,120 | $6,200 |
| 2016 | $2,039 | $25,010 | $18,117 | $6,893 |
| 2015 | $1,954 | $25,010 | $18,117 | $6,893 |
| 2014 | $1,684 | $20,280 | $9,058 | $11,222 |
Source: Public Records
Map
Nearby Homes
- 5251 E Dartmouth Ave
- 3067 S Holly Place
- 3067 Robin Way
- 2980 S Glencoe St
- 3191 S Holly Place
- 3243 S Fairfax St
- 3271 S Krameria St
- 2785 S Hudson St
- 4790 E Dartmouth Ave
- 2820 S Ivanhoe St
- 2749 S Glencoe St
- 5648 E Greenwood Place
- 4906 E Bates Ave
- 3061 S Dahlia St
- 2700 S Holly St
- 2700 S Holly St Unit 115
- 2700 S Holly St Unit 206
- 2841 S Kearney St
- 4801 E Bates Ave
- 6391 E Cornell Ave
- 3137 S Grape Way
- 3113 S Grape Way
- 5381 Highline Place
- 3101 S Grape Way
- 3100 S Grape Way
- 3132 S Grape Way
- 5361 Highline Place
- 5386 Highline Place
- 3095 S Grape Way
- 3126 S Glencoe St
- 3120 S Glencoe St
- 5372 Highline Place
- 5341 Highline Place
- 3132 S Glencoe St
- 3116 S Glencoe St
- 3091 S Grape Way
- 3136 S Glencoe St
- 5360 Highline Place
- 5321 Highline Place
- 3112 S Glencoe St