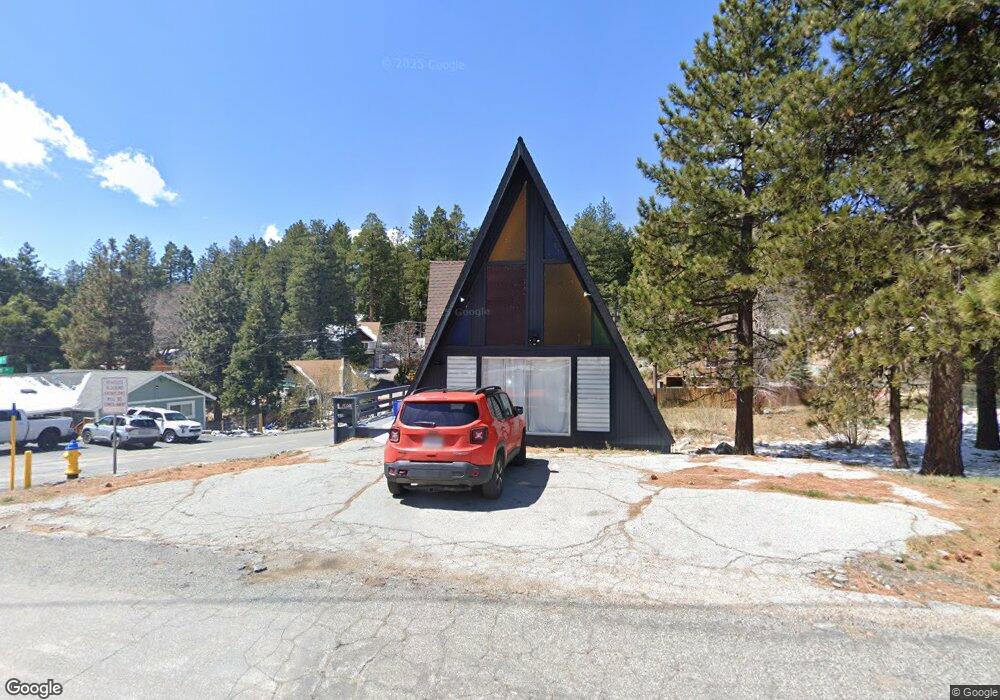
31255 Outer Highway 18 N Running Springs, CA 92382
Estimated Value: $334,856 - $373,000
1
Bed
2
Baths
1,449
Sq Ft
$244/Sq Ft
Est. Value
About This Home
This home is located at 31255 Outer Highway 18 N, Running Springs, CA 92382 and is currently estimated at $353,928, approximately $244 per square foot. 31255 Outer Highway 18 N is a home located in San Bernardino County with nearby schools including Charles Hoffman Elementary School, Mary P. Henck Intermediate School, and Rim Of The World Senior High School.
Ownership History
Date
Name
Owned For
Owner Type
Purchase Details
Closed on
May 6, 2021
Sold by
Bailey Edmond Scott and Family Estate Living Trust
Bought by
Bailey Edmond Scott and Family Estate Living Trust
Current Estimated Value
Home Financials for this Owner
Home Financials are based on the most recent Mortgage that was taken out on this home.
Original Mortgage
$256,500
Outstanding Balance
$231,086
Interest Rate
3%
Mortgage Type
New Conventional
Estimated Equity
$122,842
Purchase Details
Closed on
Mar 19, 2021
Sold by
Lark Robert L and Lark Caryl A
Bought by
Bailey Edmond Scott
Home Financials for this Owner
Home Financials are based on the most recent Mortgage that was taken out on this home.
Original Mortgage
$256,500
Outstanding Balance
$231,086
Interest Rate
3%
Mortgage Type
New Conventional
Estimated Equity
$122,842
Purchase Details
Closed on
Aug 14, 1999
Sold by
Lark Caryl A
Bought by
Lark Robert L and Lark Caryl A
Purchase Details
Closed on
Jun 21, 1994
Sold by
Lark Robert L and Lark Caryl A
Bought by
Lark Caryl A
Create a Home Valuation Report for This Property
The Home Valuation Report is an in-depth analysis detailing your home's value as well as a comparison with similar homes in the area
Home Values in the Area
Average Home Value in this Area
Purchase History
| Date | Buyer | Sale Price | Title Company |
|---|---|---|---|
| Bailey Edmond Scott | -- | Stewart Title Of Ca Inc | |
| Bailey Edmond Scott | $280,000 | Stewart Title | |
| Lark Robert L | -- | -- | |
| Lark Caryl A | -- | -- |
Source: Public Records
Mortgage History
| Date | Status | Borrower | Loan Amount |
|---|---|---|---|
| Open | Bailey Edmond Scott | $256,500 |
Source: Public Records
Tax History Compared to Growth
Tax History
| Year | Tax Paid | Tax Assessment Tax Assessment Total Assessment is a certain percentage of the fair market value that is determined by local assessors to be the total taxable value of land and additions on the property. | Land | Improvement |
|---|---|---|---|---|
| 2025 | $3,374 | $276,020 | $45,462 | $230,558 |
| 2024 | $3,374 | $270,608 | $44,571 | $226,037 |
| 2023 | $3,335 | $265,302 | $43,697 | $221,605 |
| 2022 | $3,656 | $260,100 | $42,840 | $217,260 |
| 2021 | $2,369 | $174,972 | $33,330 | $141,642 |
| 2020 | $2,369 | $173,178 | $32,988 | $140,190 |
| 2019 | $2,313 | $169,782 | $32,341 | $137,441 |
| 2018 | $2,191 | $166,453 | $31,707 | $134,746 |
| 2017 | $2,154 | $163,189 | $31,085 | $132,104 |
| 2016 | $2,092 | $159,989 | $30,475 | $129,514 |
| 2015 | $2,071 | $157,586 | $30,017 | $127,569 |
| 2014 | $1,871 | $139,700 | $27,500 | $112,200 |
Source: Public Records
Map
Nearby Homes
- 2113 Spring Oak Dr
- 2212 Spring Oak Dr
- 31162 All View Dr
- 2236 Spring Oak Dr
- 31308 Firwood Dr
- 31345 Cedarwood Dr
- 2402 Spring Oak Dr
- 2458 Spring Oak Dr
- 31354 Overhill Dr
- 31321 Circle View Dr
- 31120 Mountain Oak Dr
- 31377 Overhill Dr
- 31347 Circle View Dr
- 2313 Spring Oak Dr
- 31140 Summit Dr
- 31124 All View Dr
- 31116 All View Dr
- 30997 Wild Oak Dr
- 31117 All View Dr
- 31466 Onacrest Dr
- 31255 Old Highway 18 N
- 31241 S Outer State Hwy
- 31241 Outer Highway 18
- 31221 Glenview Dr
- 2145 Spring Oak Dr
- 2175 Spring Oak Dr
- 2135 Spring Oak Dr
- 2131 Spring Oak Dr
- 2129 Spring Oak Dr
- 31229 Outer Highway 18
- 2125 Spring Oak Dr
- 2170 Spring Oak Dr
- 2158 Spring Oak Dr
- 31225 Old Highway 18 N
- 31259 Circle View Dr
- 2176 Spring Oak Dr
- 2186 Spring Oak Dr
- 2140 Spring Oak Dr
- 31265 Circle View Dr
- 2209 Spring Oak Dr