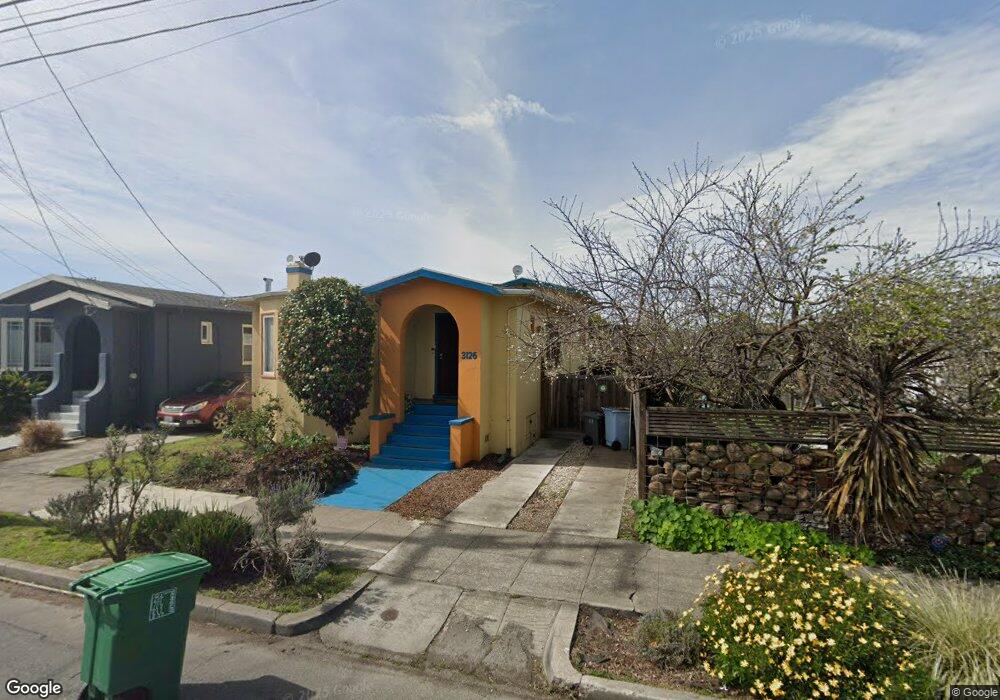
3126 Mabel St Berkeley, CA 94702
West Berkeley NeighborhoodEstimated Value: $983,000 - $1,173,000
2
Beds
1
Bath
1,112
Sq Ft
$982/Sq Ft
Est. Value
About This Home
This home is located at 3126 Mabel St, Berkeley, CA 94702 and is currently estimated at $1,091,796, approximately $981 per square foot. 3126 Mabel St is a home located in Alameda County with nearby schools including Sankofa United Elementary School, Claremont Middle School, and Oakland Technical High School.
Ownership History
Date
Name
Owned For
Owner Type
Purchase Details
Closed on
Mar 2, 2009
Sold by
Lippman Wayne B
Bought by
Connolly Peter M and Ebron Grace
Current Estimated Value
Home Financials for this Owner
Home Financials are based on the most recent Mortgage that was taken out on this home.
Original Mortgage
$344,000
Outstanding Balance
$218,157
Interest Rate
5.08%
Mortgage Type
Purchase Money Mortgage
Estimated Equity
$873,639
Purchase Details
Closed on
Aug 5, 2008
Sold by
Mbugua George G
Bought by
Lippman Wayne B
Home Financials for this Owner
Home Financials are based on the most recent Mortgage that was taken out on this home.
Original Mortgage
$146,600
Interest Rate
6.32%
Mortgage Type
Purchase Money Mortgage
Purchase Details
Closed on
Jun 5, 1996
Sold by
Williams Nancy Ann
Bought by
Williams Kevin Scott
Purchase Details
Closed on
Nov 29, 1993
Sold by
Russell Joanne and The Estate Of Hollis Broderick
Bought by
Mbugua George G
Home Financials for this Owner
Home Financials are based on the most recent Mortgage that was taken out on this home.
Original Mortgage
$97,850
Interest Rate
6.74%
Create a Home Valuation Report for This Property
The Home Valuation Report is an in-depth analysis detailing your home's value as well as a comparison with similar homes in the area
Home Values in the Area
Average Home Value in this Area
Purchase History
| Date | Buyer | Sale Price | Title Company |
|---|---|---|---|
| Connolly Peter M | $430,000 | Old Republic Title Company | |
| Lippman Wayne B | $266,500 | None Available | |
| Williams Kevin Scott | -- | Placer Title Company | |
| Mbugua George G | $103,000 | Northwestern Title Co |
Source: Public Records
Mortgage History
| Date | Status | Borrower | Loan Amount |
|---|---|---|---|
| Open | Connolly Peter M | $344,000 | |
| Previous Owner | Lippman Wayne B | $146,600 | |
| Previous Owner | Mbugua George G | $97,850 |
Source: Public Records
Tax History
| Year | Tax Paid | Tax Assessment Tax Assessment Total Assessment is a certain percentage of the fair market value that is determined by local assessors to be the total taxable value of land and additions on the property. | Land | Improvement |
|---|---|---|---|---|
| 2025 | $9,057 | $546,710 | $169,976 | $383,734 |
| 2024 | $9,057 | $535,855 | $166,643 | $376,212 |
| 2023 | $8,860 | $532,211 | $163,376 | $368,835 |
| 2022 | $8,685 | $514,779 | $160,173 | $361,606 |
| 2021 | $8,693 | $504,549 | $157,033 | $354,516 |
| 2020 | $8,195 | $506,306 | $155,424 | $350,882 |
| 2019 | $7,836 | $496,382 | $152,377 | $344,005 |
| 2018 | $7,694 | $486,651 | $149,390 | $337,261 |
| 2017 | $7,408 | $477,109 | $146,461 | $330,648 |
| 2016 | $7,143 | $467,756 | $143,590 | $324,166 |
| 2015 | $7,044 | $460,733 | $141,434 | $319,299 |
| 2014 | $7,063 | $451,707 | $138,663 | $313,044 |
Source: Public Records
Map
Nearby Homes
- 1080 67th St
- 3032 Mabel St
- 1314 Ashby Ave
- 1046 Alcatraz Ave
- 6500 San Pablo Ave
- 3000 Acton St
- 6501 San Pablo Ave Unit 410
- 1237 Ashby Ave
- 6465 San Pablo Ave Unit 306
- 3101 Sacramento St
- 1126 Ocean Ave
- 1507 Prince St
- 3224 Sacramento St
- 1150 Ocean Ave
- 2922 Stanton St
- 1164 Ocean Ave
- 1156 64th St
- 3138 California St
- 3114 California St
- 1124 63rd St
Your Personal Tour Guide
Ask me questions while you tour the home.