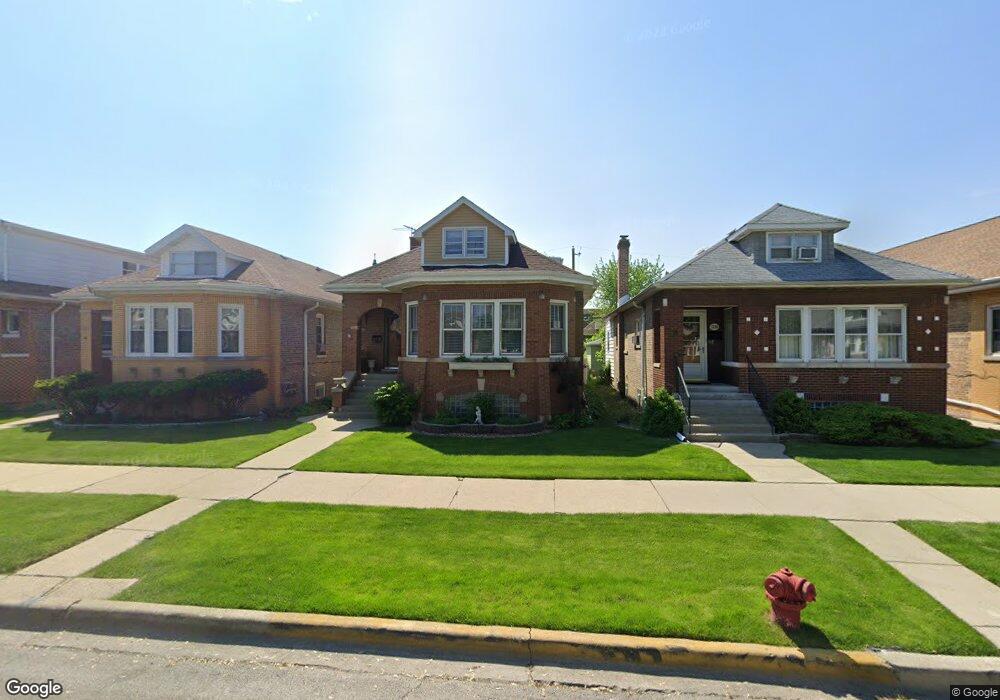
3126 N Monitor Ave Chicago, IL 60634
Belmont Central NeighborhoodEstimated Value: $373,000 - $466,000
4
Beds
2
Baths
1,404
Sq Ft
$307/Sq Ft
Est. Value
About This Home
This home is located at 3126 N Monitor Ave, Chicago, IL 60634 and is currently estimated at $430,954, approximately $306 per square foot. 3126 N Monitor Ave is a home located in Cook County with nearby schools including Lyon Elementary School, Steinmetz College Prep, and St Ferdinand Parish School.
Ownership History
Date
Name
Owned For
Owner Type
Purchase Details
Closed on
Aug 29, 2003
Sold by
Lakhman Tanasiy
Bought by
Cuello Ana and Cuello Guillermo
Current Estimated Value
Home Financials for this Owner
Home Financials are based on the most recent Mortgage that was taken out on this home.
Original Mortgage
$306,000
Interest Rate
6.4%
Mortgage Type
Unknown
Purchase Details
Closed on
Jan 30, 2003
Sold by
Milkowski Teresa K and Milkowski Marian
Bought by
Lakhman Tanasiy
Home Financials for this Owner
Home Financials are based on the most recent Mortgage that was taken out on this home.
Original Mortgage
$256,500
Interest Rate
6.07%
Purchase Details
Closed on
Jul 22, 2002
Sold by
U S Bank Na
Bought by
Milkowski Teresa K and Milkowski Marian
Home Financials for this Owner
Home Financials are based on the most recent Mortgage that was taken out on this home.
Original Mortgage
$160,000
Interest Rate
5.5%
Create a Home Valuation Report for This Property
The Home Valuation Report is an in-depth analysis detailing your home's value as well as a comparison with similar homes in the area
Home Values in the Area
Average Home Value in this Area
Purchase History
| Date | Buyer | Sale Price | Title Company |
|---|---|---|---|
| Cuello Ana | $308,000 | Multiple | |
| Lakhman Tanasiy | $270,000 | Multiple | |
| Milkowski Teresa K | $200,000 | Prairie Title |
Source: Public Records
Mortgage History
| Date | Status | Borrower | Loan Amount |
|---|---|---|---|
| Closed | Cuello Ana | $306,000 | |
| Previous Owner | Lakhman Tanasiy | $256,500 | |
| Previous Owner | Milkowski Teresa K | $160,000 |
Source: Public Records
Tax History Compared to Growth
Tax History
| Year | Tax Paid | Tax Assessment Tax Assessment Total Assessment is a certain percentage of the fair market value that is determined by local assessors to be the total taxable value of land and additions on the property. | Land | Improvement |
|---|---|---|---|---|
| 2024 | $5,422 | $32,000 | $12,685 | $19,315 |
| 2023 | $5,264 | $29,000 | $10,230 | $18,770 |
| 2022 | $5,264 | $29,000 | $10,230 | $18,770 |
| 2021 | $5,165 | $29,000 | $10,230 | $18,770 |
| 2020 | $4,435 | $22,998 | $5,115 | $17,883 |
| 2019 | $4,505 | $25,841 | $5,115 | $20,726 |
| 2018 | $4,429 | $25,841 | $5,115 | $20,726 |
| 2017 | $4,570 | $24,591 | $4,501 | $20,090 |
| 2016 | $4,428 | $24,591 | $4,501 | $20,090 |
| 2015 | $4,028 | $24,591 | $4,501 | $20,090 |
| 2014 | $3,856 | $23,334 | $4,092 | $19,242 |
| 2013 | $3,768 | $23,334 | $4,092 | $19,242 |
Source: Public Records
Map
Nearby Homes
- 6014 W Fletcher St
- 3052 N Major Ave
- 5709 W Melrose St
- 2951 N Austin Ave
- 6057 W Melrose St
- 6049 W School St
- 5853 W Newport Ave
- 5736 W Roscoe St
- 6049 W Roscoe St
- 5534 W Barry Ave
- 3036 N Luna Ave
- 2851 N Major Ave
- 5836 W Diversey Ave
- 2852 N Meade Ave
- 2744 N Marmora Ave
- 5923 W Eddy St
- 2841 N Melvina Ave
- 5631 W Cornelia Ave
- 2728 N Mango Ave
- 2735 N Mango Ave
- 3124 N Monitor Ave
- 3130 N Monitor Ave
- 3134 N Monitor Ave
- 3120 N Monitor Ave
- 3132 N Monitor Ave
- 3116 N Monitor Ave
- 3136 N Monitor Ave
- 3114 N Monitor Ave
- 3140 N Monitor Ave
- 3127 N Marmora Ave
- 3125 N Marmora Ave
- 3131 N Marmora Ave
- 3121 N Marmora Ave
- 3135 N Marmora Ave
- 3144 N Monitor Ave
- 3110 N Monitor Ave
- 3137 N Marmora Ave
- 3117 N Marmora Ave
- 3117 N Marmora Ave
- 3127 N Monitor Ave