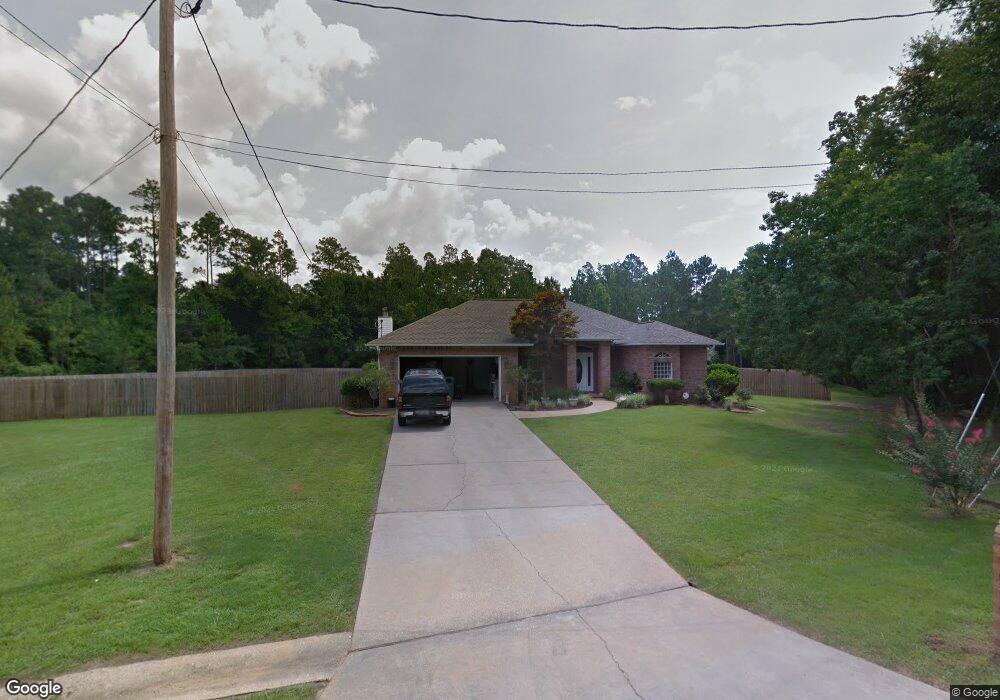
3126 Sonya St Milton, FL 32571
Estimated Value: $476,000 - $560,000
4
Beds
3
Baths
2,796
Sq Ft
$182/Sq Ft
Est. Value
About This Home
This home is located at 3126 Sonya St, Milton, FL 32571 and is currently estimated at $509,165, approximately $182 per square foot. 3126 Sonya St is a home located in Santa Rosa County with nearby schools including S.S. Dixon Primary School, S.S. Dixon Intermediate School, and Thomas L. Sims Middle School.
Ownership History
Date
Name
Owned For
Owner Type
Purchase Details
Closed on
Aug 27, 2025
Sold by
Cumberland Randy Lee
Bought by
Cumberland Randy Lee and Cumberland Shaun Michael
Current Estimated Value
Purchase Details
Closed on
Aug 19, 1996
Sold by
Bradford Bldr Inc
Bought by
Cumberland Randy L and Cumberland Donna F
Home Financials for this Owner
Home Financials are based on the most recent Mortgage that was taken out on this home.
Original Mortgage
$135,600
Interest Rate
8.21%
Create a Home Valuation Report for This Property
The Home Valuation Report is an in-depth analysis detailing your home's value as well as a comparison with similar homes in the area
Home Values in the Area
Average Home Value in this Area
Purchase History
| Date | Buyer | Sale Price | Title Company |
|---|---|---|---|
| Cumberland Randy Lee | $100 | None Listed On Document | |
| Cumberland Randy L | $21,000 | -- |
Source: Public Records
Mortgage History
| Date | Status | Borrower | Loan Amount |
|---|---|---|---|
| Previous Owner | Cumberland Randy L | $135,600 |
Source: Public Records
Tax History
| Year | Tax Paid | Tax Assessment Tax Assessment Total Assessment is a certain percentage of the fair market value that is determined by local assessors to be the total taxable value of land and additions on the property. | Land | Improvement |
|---|---|---|---|---|
| 2025 | $2,445 | $225,387 | -- | -- |
| 2024 | $2,266 | $219,035 | -- | -- |
| 2023 | $2,266 | $212,655 | $0 | $0 |
| 2022 | $2,206 | $206,461 | $0 | $0 |
| 2021 | $2,180 | $200,448 | $0 | $0 |
| 2020 | $2,168 | $197,680 | $0 | $0 |
| 2019 | $2,114 | $193,236 | $0 | $0 |
| 2018 | $2,048 | $189,633 | $0 | $0 |
| 2017 | $1,975 | $185,733 | $0 | $0 |
| 2016 | $1,983 | $182,651 | $0 | $0 |
| 2015 | $2,128 | $181,381 | $0 | $0 |
| 2014 | $2,157 | $179,941 | $0 | $0 |
Source: Public Records
Map
Nearby Homes
- 3108 Sonya St
- 5005 Ponitz Pkwy
- 5008 Pattock Place
- 5052 Roland Rd
- 3314 Abel Ave
- 0 Woodbine Rd Unit 784364
- 0 Woodbine Rd Unit 672017
- 00 Woodbine Rd
- 4749 Redhead Ct
- 4745 Redhead Ct
- 4753 Redhead Ct
- 4733 Redhead Ct
- 5121 Rowe Trail
- 5132 Rowe Trail
- 4975 Jack Cobb Ln
- 3316 Joanna Dr
- 5271 Joanna Terrace
- 3275 Melvin Dr
- 3514 Sweet Bay Dr
- 3232 Southfork Dr
Your Personal Tour Guide
Ask me questions while you tour the home.