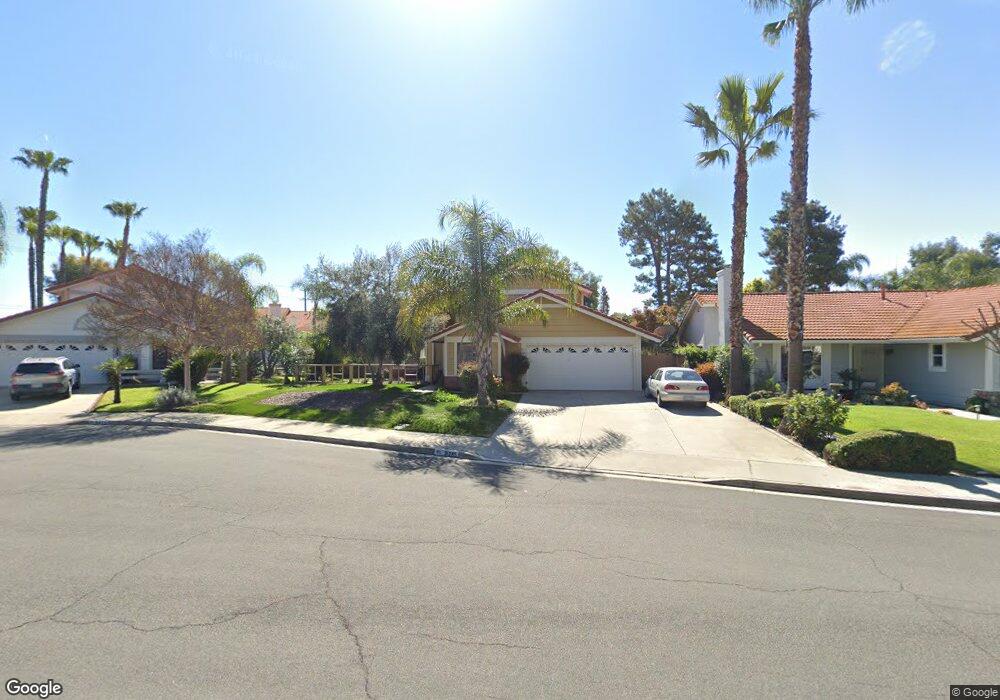
31265 Hiawatha Ct Temecula, CA 92592
Estimated Value: $670,159 - $821,000
4
Beds
3
Baths
2,113
Sq Ft
$349/Sq Ft
Est. Value
About This Home
This home is located at 31265 Hiawatha Ct, Temecula, CA 92592 and is currently estimated at $737,540, approximately $349 per square foot. 31265 Hiawatha Ct is a home located in Riverside County with nearby schools including Temecula Luiseno Elementary, Erle Stanley Gardner Middle School, and Great Oak High School.
Ownership History
Date
Name
Owned For
Owner Type
Purchase Details
Closed on
Mar 8, 2006
Sold by
Cudal Perfecto
Bought by
Mabanta Quintin C and Mabanta Catalina D
Current Estimated Value
Purchase Details
Closed on
Nov 21, 2005
Sold by
Mabanta Quintin C and Mabanta Catalina D
Bought by
Mabanta Quintin C and Mabanta Catalina D
Purchase Details
Closed on
Mar 18, 2005
Sold by
Dauz Adelina G
Bought by
Mabanta Quintin C and Mabanta Catalina D
Purchase Details
Closed on
Jun 15, 2004
Sold by
Thomas Brian Richard and Thomas Debbie Kathleen
Bought by
Mabanta Quintin C and Mabanta Catalina D
Purchase Details
Closed on
Aug 10, 1999
Sold by
Ho Ka Ming and Chau Ping Sum
Bought by
Thomas Brian Richard and Thomas Debbie Kathleen
Home Financials for this Owner
Home Financials are based on the most recent Mortgage that was taken out on this home.
Original Mortgage
$171,831
Interest Rate
7.56%
Mortgage Type
FHA
Create a Home Valuation Report for This Property
The Home Valuation Report is an in-depth analysis detailing your home's value as well as a comparison with similar homes in the area
Purchase History
| Date | Buyer | Sale Price | Title Company |
|---|---|---|---|
| Mabanta Quintin C | -- | None Available | |
| Mabanta Quintin C | -- | -- | |
| Mabanta Quintin C | -- | -- | |
| Mabanta Quintin C | $420,000 | New Century Title Company Ri | |
| Thomas Brian Richard | $173,000 | First American Title Co |
Source: Public Records
Mortgage History
| Date | Status | Borrower | Loan Amount |
|---|---|---|---|
| Previous Owner | Thomas Brian Richard | $171,831 |
Source: Public Records
Tax History
| Year | Tax Paid | Tax Assessment Tax Assessment Total Assessment is a certain percentage of the fair market value that is determined by local assessors to be the total taxable value of land and additions on the property. | Land | Improvement |
|---|---|---|---|---|
| 2025 | $6,784 | $585,416 | $132,406 | $453,010 |
| 2023 | $6,784 | $562,685 | $127,265 | $435,420 |
| 2022 | $6,576 | $551,653 | $124,770 | $426,883 |
| 2021 | $5,869 | $489,495 | $110,376 | $379,119 |
| 2020 | $5,278 | $437,049 | $98,550 | $338,499 |
| 2019 | $5,153 | $424,320 | $95,680 | $328,640 |
| 2018 | $4,961 | $408,000 | $92,000 | $316,000 |
| 2017 | $4,916 | $404,000 | $91,000 | $313,000 |
| 2016 | $4,562 | $373,000 | $84,000 | $289,000 |
| 2015 | $4,276 | $349,000 | $79,000 | $270,000 |
| 2014 | $3,979 | $327,000 | $74,000 | $253,000 |
Source: Public Records
Map
Nearby Homes
- 31348 Huron St
- 31155 Lahontan St
- 31218 Comotilo Ct
- 45374 Zuma Dr
- 31109 Shicali Ct
- 31543 Mendocino Ct
- 31579 Mendocino Ct
- 31352 Via Eduardo
- 45320 Esmerado Ct
- 45303 Esmerado Ct
- 31605 Seastar Place
- 31814 Murdock Ln
- 45495 Peacock Place
- 45511 Seagull Way
- 45418 Seagull Way
- 30945 Sawgrass Ct
- 30932 Greensboro Dr
- 31935 Bitterroot Ct
- 31564 Calle Canto
- 31889 Red Pine Way
- 31257 Hiawatha Ct
- 31273 Hiawatha Ct
- 31294 Bocaw Cir
- 31249 Hiawatha Ct
- 31302 Bocaw Cir
- 31286 Bocaw Cir
- 31281 Hiawatha Ct
- 31260 Hiawatha Ct
- 31252 Hiawatha Ct
- 31276 Hiawatha Ct
- 31310 Bocaw Cir
- 31268 Hiawatha Ct
- 31244 Hiawatha Ct
- 45561 Piute St
- 45535 Piute St
- 31315 Bocaw Cir
- 45585 Piute St
- 31291 Bocaw Cir
- 31299 Bocaw Cir
- 45510 Piute St
Your Personal Tour Guide
Ask me questions while you tour the home.