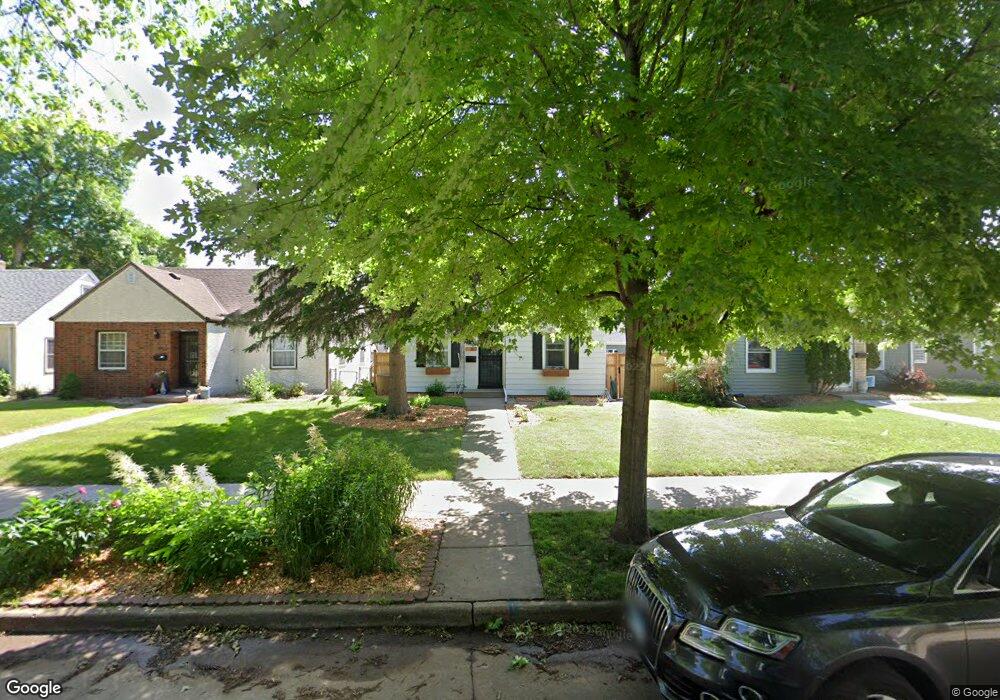
3127 Benjamin St NE Minneapolis, MN 55418
Waite Park NeighborhoodEstimated Value: $349,404 - $390,000
3
Beds
2
Baths
1,140
Sq Ft
$324/Sq Ft
Est. Value
About This Home
This home is located at 3127 Benjamin St NE, Minneapolis, MN 55418 and is currently estimated at $368,851, approximately $323 per square foot. 3127 Benjamin St NE is a home located in Hennepin County with nearby schools including Waite Park Elementary School, Northeast Middle School, and Thomas Edison High School.
Ownership History
Date
Name
Owned For
Owner Type
Purchase Details
Closed on
Jul 18, 2016
Sold by
Chase Guy B and Chase Holly S
Bought by
Olsen Bryan M and Olsen Demi L
Current Estimated Value
Home Financials for this Owner
Home Financials are based on the most recent Mortgage that was taken out on this home.
Original Mortgage
$263,220
Outstanding Balance
$210,669
Interest Rate
3.66%
Mortgage Type
New Conventional
Estimated Equity
$158,182
Purchase Details
Closed on
Dec 28, 2007
Sold by
Mckibben Jennifer C
Bought by
Peelen Holly S and Chase Guy B
Purchase Details
Closed on
Mar 22, 2002
Sold by
Doerrer Daniel J and Doerrer Lynn S
Bought by
Mckibben Jennifer C
Purchase Details
Closed on
May 29, 1997
Sold by
Ester John B and Ester Joy A
Bought by
Sparks Lynn E
Create a Home Valuation Report for This Property
The Home Valuation Report is an in-depth analysis detailing your home's value as well as a comparison with similar homes in the area
Home Values in the Area
Average Home Value in this Area
Purchase History
| Date | Buyer | Sale Price | Title Company |
|---|---|---|---|
| Olsen Bryan M | $292,500 | Burnet Title | |
| Peelen Holly S | $219,900 | -- | |
| Mckibben Jennifer C | $169,900 | -- | |
| Sparks Lynn E | $96,500 | -- |
Source: Public Records
Mortgage History
| Date | Status | Borrower | Loan Amount |
|---|---|---|---|
| Open | Olsen Bryan M | $263,220 |
Source: Public Records
Tax History Compared to Growth
Tax History
| Year | Tax Paid | Tax Assessment Tax Assessment Total Assessment is a certain percentage of the fair market value that is determined by local assessors to be the total taxable value of land and additions on the property. | Land | Improvement |
|---|---|---|---|---|
| 2024 | $4,391 | $312,000 | $119,000 | $193,000 |
| 2023 | $3,937 | $310,000 | $109,000 | $201,000 |
| 2022 | $3,842 | $313,000 | $109,000 | $204,000 |
| 2021 | $3,728 | $271,500 | $63,000 | $208,500 |
| 2020 | $4,029 | $271,500 | $57,200 | $214,300 |
| 2019 | $3,832 | $271,500 | $44,800 | $226,700 |
| 2018 | $3,463 | $251,500 | $44,800 | $206,700 |
| 2017 | $2,880 | $203,500 | $40,700 | $162,800 |
| 2016 | $2,796 | $193,000 | $40,700 | $152,300 |
| 2015 | $2,686 | $179,000 | $40,700 | $138,300 |
| 2014 | -- | $168,500 | $40,700 | $127,800 |
Source: Public Records
Map
Nearby Homes
- 3243 Mckinley St NE
- 2958 NE Stinson Pkwy
- 3027 Garfield St NE
- 2850 Arthur St NE
- 2827 Hayes St NE
- 3154 Lincoln St NE
- 2807 Ulysses St NE
- 2816 29th Ave NE
- 3423 Ulysses St NE
- 3013 Silver Lake Rd NE
- 2730 Ulysses St NE
- 3243 Pierce St NE
- 3050 Pierce St NE
- 3501 Coolidge St NE
- 3615 Mckinley St NE
- 2559 Mckinley St NE
- 2501 NE Lowry Ave Unit 228
- 2501 NE Lowry Ave Unit 201
- 2546 Mckinley St NE
- 2601 Kenzie Terrace Unit 103
- 3123 Benjamin St NE
- 3131 Benjamin St NE
- 3130 Benjamin St NE
- 3119 Benjamin St NE
- 3135 Benjamin St NE
- 3139 Benjamin St NE
- 3115 Benjamin St NE
- 3122 Mckinley St NE
- 3130 Mckinley St NE
- 3111 Benjamin St NE
- 3143 Benjamin St NE
- 3118 Mckinley St NE
- 3134 Mckinley St NE
- 3114 Mckinley St NE
- 3138 Mckinley St NE
- 3126 Benjamin St NE
- 3122 Benjamin St NE
- 3107 Benjamin St NE
- 3134 Benjamin St NE
- 3134 Benjamin St NE