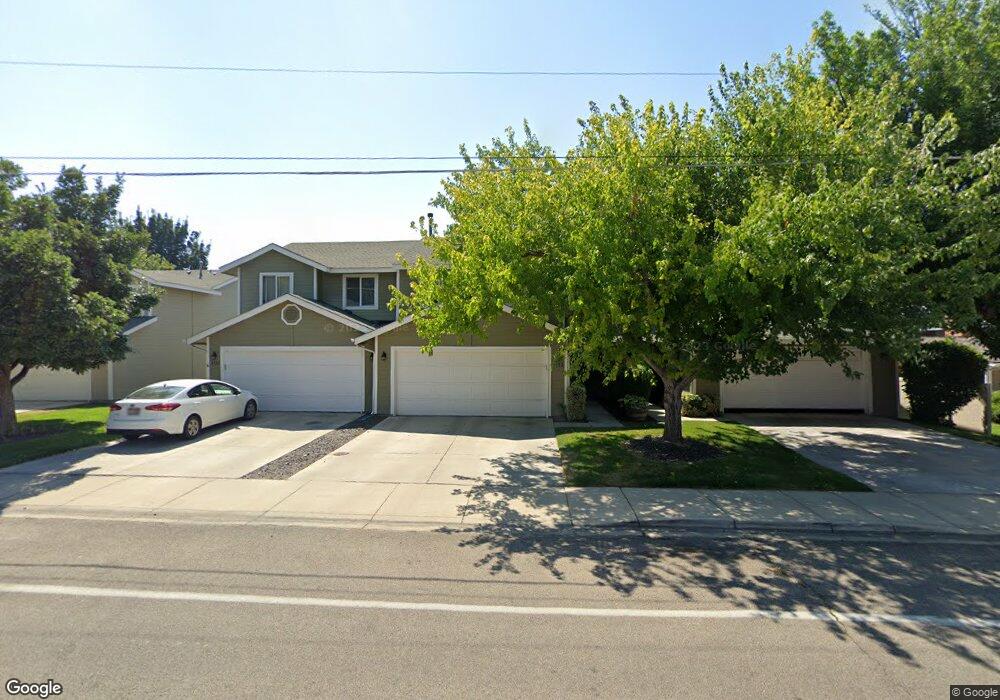
3127 N Ash Park Ln Boise, ID 83704
West Boise NeighborhoodEstimated Value: $369,000 - $444,000
3
Beds
2
Baths
1,465
Sq Ft
$271/Sq Ft
Est. Value
About This Home
This home is located at 3127 N Ash Park Ln, Boise, ID 83704 and is currently estimated at $396,298, approximately $270 per square foot. 3127 N Ash Park Ln is a home located in Ada County with nearby schools including Valley View Elementary School, Fairmont Junior High School, and Capital High School.
Ownership History
Date
Name
Owned For
Owner Type
Purchase Details
Closed on
Feb 22, 2010
Sold by
Galka Henry Floyd and Galka Carole Elizabeth
Bought by
Tate Andrew M
Current Estimated Value
Home Financials for this Owner
Home Financials are based on the most recent Mortgage that was taken out on this home.
Original Mortgage
$3,885
Outstanding Balance
$2,568
Interest Rate
4.93%
Mortgage Type
Stand Alone Second
Estimated Equity
$393,730
Purchase Details
Closed on
Sep 6, 2007
Sold by
Galka Henry Floyd and Galka Carole Elizabeth
Bought by
Galka Henry Floyd and Galka Carole Elizabeth
Purchase Details
Closed on
Jul 2, 2007
Sold by
University Plaza Llc
Bought by
Galka Henry F and Galka Carole E
Home Financials for this Owner
Home Financials are based on the most recent Mortgage that was taken out on this home.
Original Mortgage
$181,450
Interest Rate
6.36%
Mortgage Type
Purchase Money Mortgage
Purchase Details
Closed on
Dec 16, 1998
Sold by
Piel Harold L and Piel Joyce E
Bought by
University Plaza Llc
Create a Home Valuation Report for This Property
The Home Valuation Report is an in-depth analysis detailing your home's value as well as a comparison with similar homes in the area
Home Values in the Area
Average Home Value in this Area
Purchase History
| Date | Buyer | Sale Price | Title Company |
|---|---|---|---|
| Tate Andrew M | -- | Pioneer | |
| Galka Henry Floyd | -- | None Available | |
| Galka Henry F | -- | Title One | |
| University Plaza Llc | -- | Alliance Title Company |
Source: Public Records
Mortgage History
| Date | Status | Borrower | Loan Amount |
|---|---|---|---|
| Open | Tate Andrew M | $3,885 | |
| Open | Tate Andrew M | $95,645 | |
| Previous Owner | Galka Henry F | $181,450 |
Source: Public Records
Tax History Compared to Growth
Tax History
| Year | Tax Paid | Tax Assessment Tax Assessment Total Assessment is a certain percentage of the fair market value that is determined by local assessors to be the total taxable value of land and additions on the property. | Land | Improvement |
|---|---|---|---|---|
| 2025 | $3,028 | $351,900 | -- | -- |
| 2024 | $3,092 | $333,500 | -- | -- |
| 2023 | $3,092 | $323,800 | $0 | $0 |
| 2022 | $3,287 | $378,900 | $0 | $0 |
| 2021 | $3,210 | $293,600 | $0 | $0 |
| 2020 | $2,783 | $234,300 | $0 | $0 |
| 2019 | $2,961 | $218,100 | $0 | $0 |
| 2018 | $2,862 | $188,400 | $0 | $0 |
| 2017 | $2,529 | $158,200 | $0 | $0 |
| 2016 | $2,377 | $145,100 | $0 | $0 |
| 2015 | $1,175 | $132,900 | $0 | $0 |
| 2012 | -- | $87,300 | $0 | $0 |
Source: Public Records
Map
Nearby Homes
- 3084 N Network Ln
- 3019 N Network Ln
- 8007 W Scardale Ct
- 8244 W Pomona Ct
- 2870 N Camden Place
- 7701 W Ustick Rd Unit 59
- 7727 W Iron Ct
- 2934 N Manchester Place
- 2691 N Camden Ave
- 2721 N Christine St
- 7511 W Settlers Ave
- 7557 W Iron Dr
- 8475 W Westchester Ave
- 8466 W Westchester Ave
- 8631 W Canterbury St
- 3731 N Buckingham Dr
- 2709 N Cole Rd
- 3841 N Sheringham Dr
- 8752 W Canterbury St
- 3573 N Rugby Dr
- 3133 N Ash Park Ln
- 3117 N Ash Park Ln
- 3105 N Ash Park Ln
- 3111 N Ash Park Ln
- 3145 N Ash Park Ln
- 8090 W San Fernando Ct
- 3103 N Ash Park Ln
- 8092 W San Fernando Ct
- 8094 W San Fernando Ct
- 3095 N Ash Park Ln
- 3163 N Ash Park Ln
- 8084 W San Fernando Ct
- 8096 W San Fernando Ct
- 3087 N Ash Park Ln
- 8080 W San Fernando Ct
- 8098 W San Fernando Ct
- 7923 W Ustick Rd
- 3030 N Ash Park Ln
- 3079 N Ash Park Ln
- 8076 W San Fernando Ct