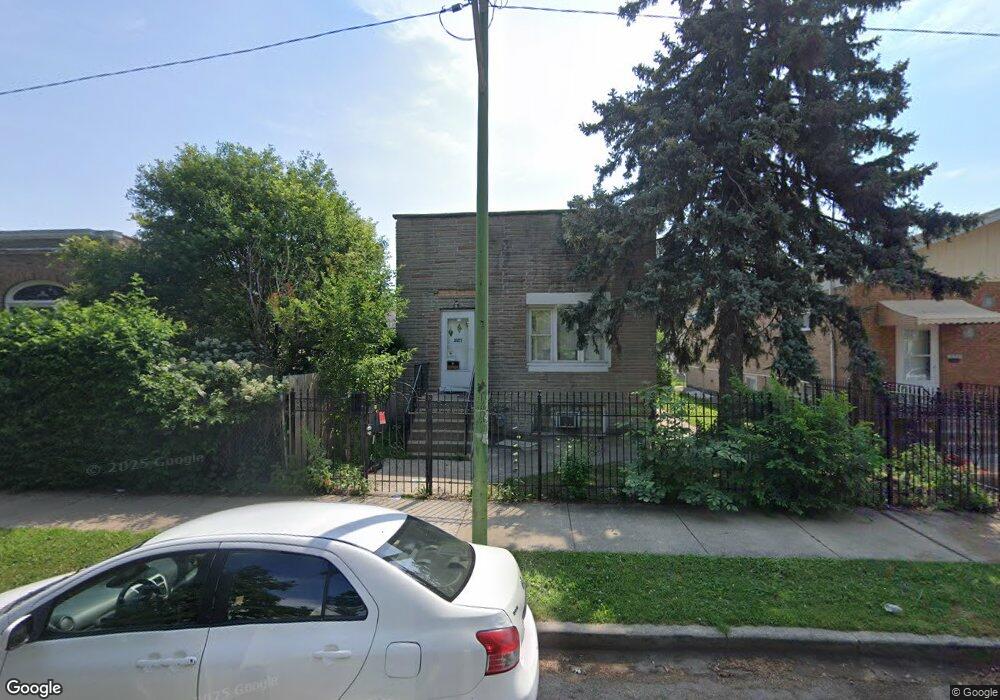
3127 S Karlov Ave Chicago, IL 60623
Little Village NeighborhoodEstimated Value: $257,619 - $305,000
2
Beds
2
Baths
1,150
Sq Ft
$243/Sq Ft
Est. Value
About This Home
This home is located at 3127 S Karlov Ave, Chicago, IL 60623 and is currently estimated at $279,905, approximately $243 per square foot. 3127 S Karlov Ave is a home located in Cook County with nearby schools including Whitney Elementary School and Grace Lutheran Academy.
Ownership History
Date
Name
Owned For
Owner Type
Purchase Details
Closed on
Jul 7, 2014
Sold by
1683 Real Estate Llc 2013 004
Bought by
Cazacu Nicolae F
Current Estimated Value
Purchase Details
Closed on
Feb 20, 2014
Sold by
Rodriguez Jose Luis
Bought by
1683 Real Estate Llc 2013 004
Purchase Details
Closed on
Feb 13, 2014
Sold by
Daley Richard J
Bought by
Pna Bank
Purchase Details
Closed on
Dec 28, 2007
Sold by
Dominguez Jose and Dominguez Lourdes L Pastora
Bought by
Rodriguez Jose Luis and Rodriguez Vilma V
Home Financials for this Owner
Home Financials are based on the most recent Mortgage that was taken out on this home.
Original Mortgage
$143,000
Interest Rate
7.87%
Mortgage Type
Unknown
Purchase Details
Closed on
May 13, 2002
Sold by
Dominguez Jose
Bought by
Dominguez Jose and Rodriguez Jose Luis
Home Financials for this Owner
Home Financials are based on the most recent Mortgage that was taken out on this home.
Original Mortgage
$114,000
Interest Rate
6.95%
Create a Home Valuation Report for This Property
The Home Valuation Report is an in-depth analysis detailing your home's value as well as a comparison with similar homes in the area
Home Values in the Area
Average Home Value in this Area
Purchase History
| Date | Buyer | Sale Price | Title Company |
|---|---|---|---|
| Cazacu Nicolae F | $25,000 | Specialty Title Service Inc | |
| 1683 Real Estate Llc 2013 004 | -- | None Available | |
| Pna Bank | $50,000 | None Available | |
| Rodriguez Jose Luis | -- | Gat | |
| Dominguez Jose | -- | -- | |
| Dominguez Jose | $144,000 | -- |
Source: Public Records
Mortgage History
| Date | Status | Borrower | Loan Amount |
|---|---|---|---|
| Previous Owner | Rodriguez Jose Luis | $143,000 | |
| Previous Owner | Dominguez Jose | $114,000 |
Source: Public Records
Tax History Compared to Growth
Tax History
| Year | Tax Paid | Tax Assessment Tax Assessment Total Assessment is a certain percentage of the fair market value that is determined by local assessors to be the total taxable value of land and additions on the property. | Land | Improvement |
|---|---|---|---|---|
| 2024 | $3,165 | $19,700 | $6,344 | $13,356 |
| 2023 | $3,085 | $15,000 | $5,141 | $9,859 |
| 2022 | $3,085 | $15,000 | $5,141 | $9,859 |
| 2021 | $3,016 | $14,999 | $5,140 | $9,859 |
| 2020 | $2,553 | $11,460 | $5,140 | $6,320 |
| 2019 | $2,616 | $13,023 | $5,140 | $7,883 |
| 2018 | $2,573 | $13,023 | $5,140 | $7,883 |
| 2017 | $2,278 | $10,584 | $4,593 | $5,991 |
| 2016 | $2,120 | $10,584 | $4,593 | $5,991 |
| 2015 | $1,939 | $10,584 | $4,593 | $5,991 |
| 2014 | $1,667 | $11,553 | $4,375 | $7,178 |
| 2013 | $1,623 | $11,553 | $4,375 | $7,178 |
Source: Public Records
Map
Nearby Homes
- 3213 S Keeler Ave
- 4200 W 31st St
- 3012 S Keeler Ave
- 2845 S Kedvale Ave
- 2828 S Keeler Ave
- 2849 S Kolin Ave
- 2652 S Komensky Ave
- 2807 S Hamlin Ave
- 3028 S Millard Ave
- 2711 S Hamlin Ave
- 2631 S Avers Ave
- 2536 S Avers Ave
- 2501 S Springfield Ave
- 2436 S Pulaski Rd
- 2434 S Pulaski Rd
- 2800 S Saint Louis Ave
- 1808 S Hamlin Ave
- 2841 S Trumbull Ave
- 2817 S Trumbull Ave
- 2802 S Homan Ave
- 3131 S Karlov Ave
- 3123 S Karlov Ave
- 3133 S Karlov Ave
- 3119 S Karlov Ave
- 3139 S Karlov Ave
- 3115 S Karlov Ave
- 3126 S Komensky Ave
- 3128 S Komensky Ave
- 3124 S Komensky Ave
- 3141 S Karlov Ave
- 3130 S Komensky Ave
- 3120 S Komensky Ave
- 3134 S Komensky Ave
- 3118 S Komensky Ave
- 3136 S Komensky Ave
- 3116 S Komensky Ave
- 3143 S Karlov Ave
- 3132 S Karlov Ave
- 3138 S Komensky Ave
- 3136 S Karlov Ave