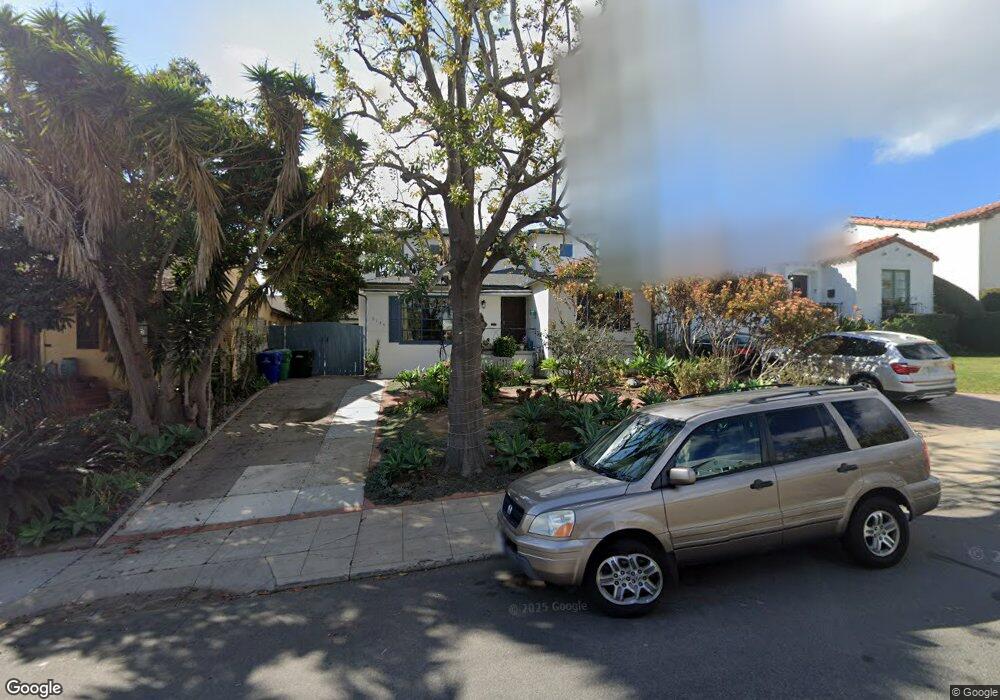
3129 Dumas St San Diego, CA 92106
Loma Portal NeighborhoodEstimated Value: $1,394,000 - $1,686,871
2
Beds
1
Bath
1,288
Sq Ft
$1,221/Sq Ft
Est. Value
About This Home
This home is located at 3129 Dumas St, San Diego, CA 92106 and is currently estimated at $1,572,718, approximately $1,221 per square foot. 3129 Dumas St is a home located in San Diego County with nearby schools including Loma Portal Elementary School, Richard Henry Dana Middle School, and Correia Middle School.
Ownership History
Date
Name
Owned For
Owner Type
Purchase Details
Closed on
Apr 12, 2012
Sold by
Felando August W and Felando Margaret Love
Bought by
Kubota Jared and Kubota Sheila
Current Estimated Value
Home Financials for this Owner
Home Financials are based on the most recent Mortgage that was taken out on this home.
Original Mortgage
$531,184
Outstanding Balance
$365,854
Interest Rate
3.85%
Mortgage Type
FHA
Estimated Equity
$1,206,864
Purchase Details
Closed on
May 28, 1993
Sold by
Felando August John and Felando Ann Fritzsche
Bought by
Felando August W and Felando Margaret Love
Home Financials for this Owner
Home Financials are based on the most recent Mortgage that was taken out on this home.
Original Mortgage
$70,000
Interest Rate
4.5%
Purchase Details
Closed on
Dec 23, 1988
Purchase Details
Closed on
May 8, 1985
Create a Home Valuation Report for This Property
The Home Valuation Report is an in-depth analysis detailing your home's value as well as a comparison with similar homes in the area
Home Values in the Area
Average Home Value in this Area
Purchase History
| Date | Buyer | Sale Price | Title Company |
|---|---|---|---|
| Kubota Jared | $545,000 | California Title Company | |
| Felando August W | -- | World Title Company | |
| -- | $230,000 | -- | |
| -- | $127,500 | -- |
Source: Public Records
Mortgage History
| Date | Status | Borrower | Loan Amount |
|---|---|---|---|
| Open | Kubota Jared | $531,184 | |
| Previous Owner | Felando August W | $70,000 |
Source: Public Records
Tax History Compared to Growth
Tax History
| Year | Tax Paid | Tax Assessment Tax Assessment Total Assessment is a certain percentage of the fair market value that is determined by local assessors to be the total taxable value of land and additions on the property. | Land | Improvement |
|---|---|---|---|---|
| 2025 | $9,444 | $787,342 | $558,940 | $228,402 |
| 2024 | $9,444 | $771,905 | $547,981 | $223,924 |
| 2023 | $9,233 | $756,771 | $537,237 | $219,534 |
| 2022 | $8,986 | $741,933 | $526,703 | $215,230 |
| 2021 | $8,922 | $727,386 | $516,376 | $211,010 |
| 2020 | $7,657 | $625,929 | $511,082 | $114,847 |
| 2019 | $7,519 | $613,657 | $501,061 | $112,596 |
| 2018 | $7,029 | $601,626 | $491,237 | $110,389 |
| 2017 | $80 | $589,830 | $481,605 | $108,225 |
| 2016 | $6,750 | $578,265 | $472,162 | $106,103 |
| 2015 | $6,649 | $569,580 | $465,070 | $104,510 |
| 2014 | $6,543 | $558,423 | $455,960 | $102,463 |
Source: Public Records
Map
Nearby Homes
- 3345 Elliott St
- 2409 Evergreen St
- 2675 Clove St
- 3111 Ibsen St
- 2205 Locust St
- 3615 Lotus Dr
- 3616 Zola St
- 3028 Sterne St
- 2035 Evergreen St
- 3126 Russell St
- 3322 Russell St
- 3761 Oleander Dr
- 3477 Coastline Place Unit 116
- 2852 Laning Rd Unit 1
- 2812 Poinsettia Dr
- 2740 E Bainbridge Rd
- 3428 Quimby St
- 3145 Quimby St
- 2359 Caminito Agrado
- 2734 Laning Rd Unit 2
- 3135 Dumas St
- 3121 Dumas St
- 3145 Dumas St
- 3130 Curtis St
- 3111 Dumas St
- 3136 Curtis St
- 2555 Evergreen St
- 3112 Curtis St
- 2572 Locust St
- 3130 Dumas St
- 3136 Dumas St
- 3124 Dumas St
- 3106 Curtis St
- 2607 Evergreen St
- 2572 Evergreen St
- Evergreen Street
- 3104 Dumas St
- 3202 Curtis St
- 3211 Dumas St
- 3131 Elliott St