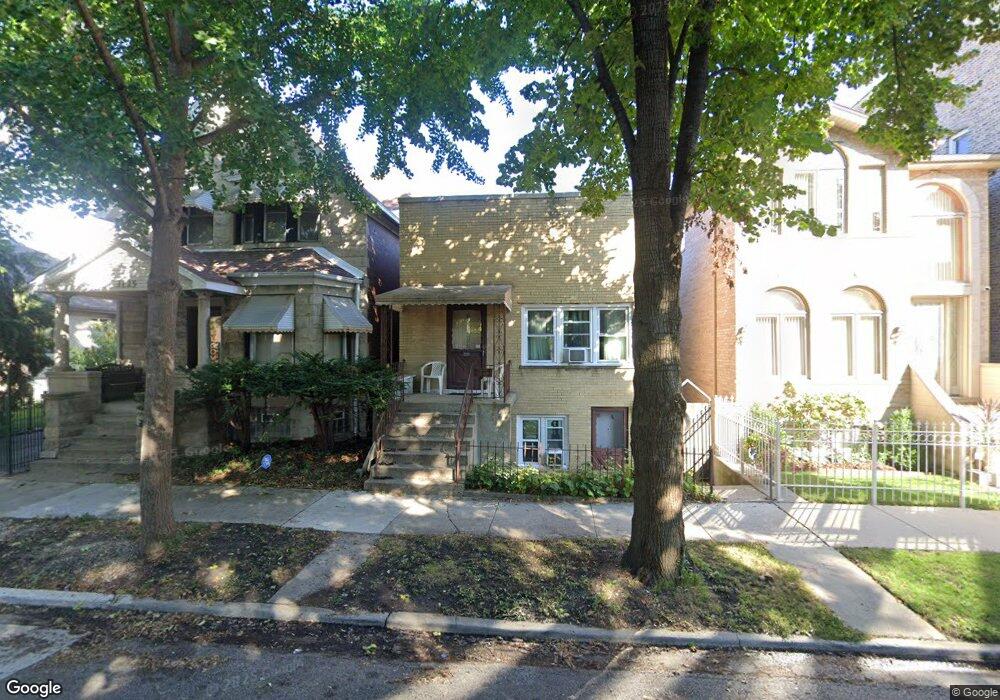
3129 S Parnell Ave Chicago, IL 60616
Bridgeport NeighborhoodEstimated Value: $372,000 - $552,000
3
Beds
1
Bath
1,113
Sq Ft
$400/Sq Ft
Est. Value
About This Home
This home is located at 3129 S Parnell Ave, Chicago, IL 60616 and is currently estimated at $444,987, approximately $399 per square foot. 3129 S Parnell Ave is a home located in Cook County with nearby schools including Healy Elementary School and St. Jerome Catholic School.
Ownership History
Date
Name
Owned For
Owner Type
Purchase Details
Closed on
Sep 17, 2004
Sold by
Casa Louise
Bought by
Duncker Susan L and Duncker Lyn J
Current Estimated Value
Home Financials for this Owner
Home Financials are based on the most recent Mortgage that was taken out on this home.
Original Mortgage
$130,000
Interest Rate
5.89%
Mortgage Type
Unknown
Purchase Details
Closed on
Dec 22, 2003
Sold by
Casa Louise
Bought by
Casa Louise and Louise Casa Revocable Living Trust
Purchase Details
Closed on
Oct 17, 2003
Sold by
Misuraca Sharon Casa
Bought by
Casa Louise
Home Financials for this Owner
Home Financials are based on the most recent Mortgage that was taken out on this home.
Original Mortgage
$100,000
Interest Rate
6.01%
Mortgage Type
Unknown
Purchase Details
Closed on
Apr 9, 2001
Sold by
Casa Felice
Bought by
Casa Felice
Purchase Details
Closed on
May 6, 1998
Sold by
First National Bank Of Evergreen Park
Bought by
Casa Felice and Misuraca Sharon Casa
Purchase Details
Closed on
Apr 28, 1997
Sold by
Calabretta Rose M
Bought by
First National Bank Of Evergreen Park and Trust #15405
Create a Home Valuation Report for This Property
The Home Valuation Report is an in-depth analysis detailing your home's value as well as a comparison with similar homes in the area
Home Values in the Area
Average Home Value in this Area
Purchase History
| Date | Buyer | Sale Price | Title Company |
|---|---|---|---|
| Duncker Susan L | $260,000 | Cti | |
| Casa Louise | -- | -- | |
| Casa Louise | $100,000 | -- | |
| Casa Felice | -- | -- | |
| Casa Felice | $150,000 | -- | |
| First National Bank Of Evergreen Park | -- | -- |
Source: Public Records
Mortgage History
| Date | Status | Borrower | Loan Amount |
|---|---|---|---|
| Closed | Duncker Susan L | $130,000 | |
| Previous Owner | Casa Louise | $100,000 |
Source: Public Records
Tax History Compared to Growth
Tax History
| Year | Tax Paid | Tax Assessment Tax Assessment Total Assessment is a certain percentage of the fair market value that is determined by local assessors to be the total taxable value of land and additions on the property. | Land | Improvement |
|---|---|---|---|---|
| 2024 | $5,841 | $36,000 | $16,928 | $19,072 |
| 2023 | $5,672 | $31,000 | $13,666 | $17,334 |
| 2022 | $5,672 | $31,000 | $13,666 | $17,334 |
| 2021 | $5,564 | $30,999 | $13,666 | $17,333 |
| 2020 | $4,424 | $22,960 | $13,666 | $9,294 |
| 2019 | $4,494 | $25,798 | $13,666 | $12,132 |
| 2018 | $4,417 | $25,798 | $13,666 | $12,132 |
| 2017 | $4,723 | $25,316 | $10,871 | $14,445 |
| 2016 | $4,570 | $25,316 | $10,871 | $14,445 |
| 2015 | $4,158 | $25,316 | $10,871 | $14,445 |
| 2014 | $3,834 | $23,230 | $9,318 | $13,912 |
| 2013 | $3,747 | $23,230 | $9,318 | $13,912 |
Source: Public Records
Map
Nearby Homes
- 3120 S Normal Ave
- 3214 S Canal St
- 3246 S Normal Ave
- 3148 S Union Ave
- 3212 S Union Ave
- 3028 S Union Ave
- 714 W 31st St
- 3322 S Parnell Ave
- 3315 S Lowe Ave
- 3011 S Emerald Ave
- 3247 S Emerald Ave
- 450 W 29th St
- 2906 S Lowe Ave
- 3234 S Princeton Ave
- 2849 S Normal Ave
- 2916 S Union Ave
- 3106 S Wells St Unit 1
- 3106 S Wells St Unit 3
- 238 W 31st St Unit 2E
- 238 W 31st St Unit 4W
- 3131 S Parnell Ave
- 3125 S Parnell Ave
- 3133 S Parnell Ave
- 3137 S Parnell Ave
- 3121 S Parnell Ave
- 3139 S Parnell Ave
- 3119 S Parnell Ave
- 3141 S Parnell Ave
- 3128 S Normal Ave
- 3126 S Normal Ave
- 3132 S Normal Ave
- 3124 S Normal Ave
- 3115 S Parnell Ave
- 3136 S Normal Ave
- 3145 S Parnell Ave
- 3120 S Normal Ave
- 3134 S Normal Ave
- 3134 S Normal Ave Unit 1
- 3138 S Normal Ave Unit 1
- 3116 S Normal Ave