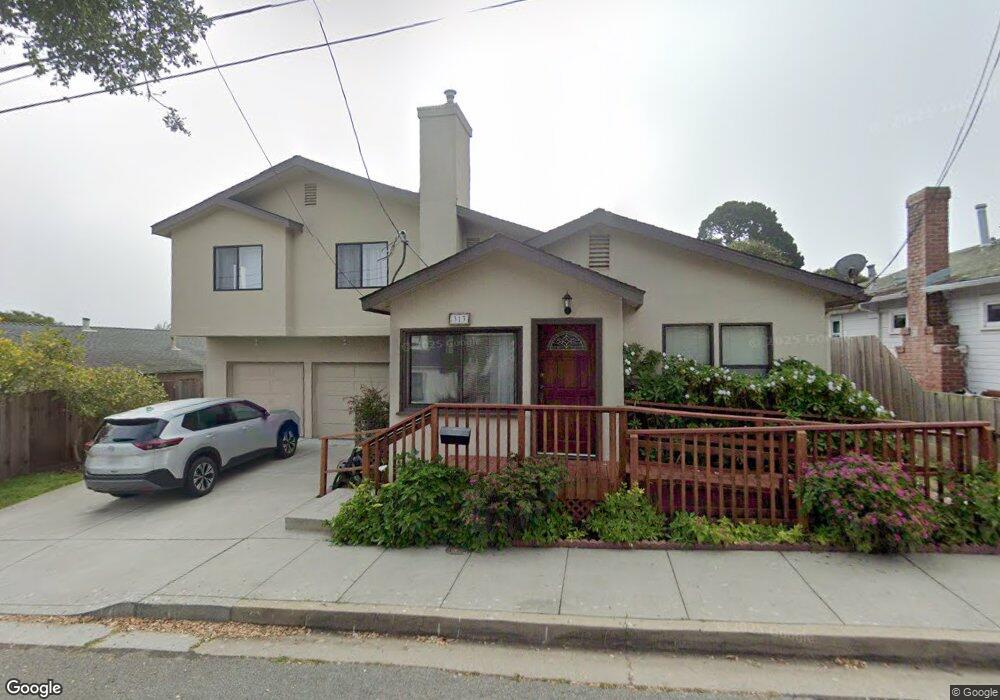
313 3rd St Pacific Grove, CA 93950
Estimated Value: $1,294,692 - $1,787,000
3
Beds
2
Baths
1,573
Sq Ft
$916/Sq Ft
Est. Value
About This Home
This home is located at 313 3rd St, Pacific Grove, CA 93950 and is currently estimated at $1,440,673, approximately $915 per square foot. 313 3rd St is a home located in Monterey County with nearby schools including Robert Down Elementary School, Pacific Grove Middle School, and Pacific Grove High School.
Ownership History
Date
Name
Owned For
Owner Type
Purchase Details
Closed on
Oct 3, 2022
Sold by
Renken Danielle Marie France
Bought by
Dmr Property Llc
Current Estimated Value
Purchase Details
Closed on
Jan 5, 2021
Sold by
Residual Trust and Renken Trust
Bought by
Renken Danielle Marie France
Purchase Details
Closed on
Aug 27, 2009
Sold by
Renken Daniel A and Renken Danielle Marie France
Bought by
Renken Daniel A and Renken Danielle Marie France
Purchase Details
Closed on
Jun 7, 1994
Sold by
Renken Daniel A and Renken Ginette A
Bought by
Renken Daniel A and Renken Ginette A
Create a Home Valuation Report for This Property
The Home Valuation Report is an in-depth analysis detailing your home's value as well as a comparison with similar homes in the area
Home Values in the Area
Average Home Value in this Area
Purchase History
| Date | Buyer | Sale Price | Title Company |
|---|---|---|---|
| Dmr Property Llc | -- | None Listed On Document | |
| Renken Danielle Marie France | -- | None Listed On Document | |
| Renken Daniel A | -- | None Available | |
| Renken Daniel A | -- | -- |
Source: Public Records
Tax History
| Year | Tax Paid | Tax Assessment Tax Assessment Total Assessment is a certain percentage of the fair market value that is determined by local assessors to be the total taxable value of land and additions on the property. | Land | Improvement |
|---|---|---|---|---|
| 2025 | $2,334 | $219,898 | $57,494 | $162,404 |
| 2024 | $2,334 | $215,587 | $56,367 | $159,220 |
| 2023 | $2,406 | $211,361 | $55,262 | $156,099 |
| 2022 | $2,359 | $207,218 | $54,179 | $153,039 |
| 2021 | $2,347 | $203,156 | $53,117 | $150,039 |
| 2020 | $2,300 | $201,074 | $52,573 | $148,501 |
| 2019 | $2,229 | $197,133 | $51,543 | $145,590 |
| 2018 | $2,187 | $193,269 | $50,533 | $142,736 |
| 2017 | $2,153 | $189,481 | $49,543 | $139,938 |
| 2016 | $2,157 | $185,767 | $48,572 | $137,195 |
| 2015 | $2,123 | $182,978 | $47,843 | $135,135 |
| 2014 | $2,080 | $179,394 | $46,906 | $132,488 |
Source: Public Records
Map
Nearby Homes
Your Personal Tour Guide
Ask me questions while you tour the home.