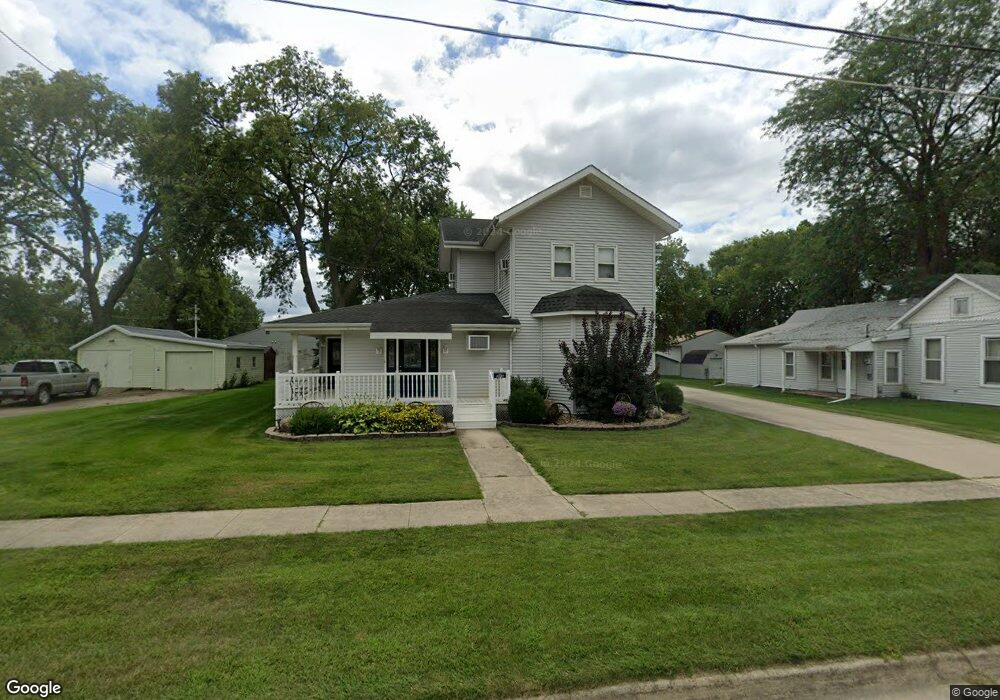
313 7th St SE Independence, IA 50644
Estimated Value: $218,000 - $279,000
3
Beds
4
Baths
2,424
Sq Ft
$97/Sq Ft
Est. Value
About This Home
This home is located at 313 7th St SE, Independence, IA 50644 and is currently estimated at $235,794, approximately $97 per square foot. 313 7th St SE is a home located in Buchanan County with nearby schools including West Elementary School, East Elementary School, and Independence Junior/Senior High School.
Ownership History
Date
Name
Owned For
Owner Type
Purchase Details
Closed on
Mar 7, 2018
Sold by
Ruiz Deanna N and Lee Deanna N
Bought by
Lee Rick A
Current Estimated Value
Purchase Details
Closed on
Feb 13, 2017
Sold by
Lee Rick A and Lee Deanna Nancy
Bought by
Lee Rick A and Lee Deanna Nancy
Purchase Details
Closed on
Jul 28, 2005
Sold by
Brayton Bradley C and Brayton Ardela K
Bought by
Lee Rick A
Home Financials for this Owner
Home Financials are based on the most recent Mortgage that was taken out on this home.
Original Mortgage
$103,000
Interest Rate
5.66%
Mortgage Type
New Conventional
Create a Home Valuation Report for This Property
The Home Valuation Report is an in-depth analysis detailing your home's value as well as a comparison with similar homes in the area
Home Values in the Area
Average Home Value in this Area
Purchase History
| Date | Buyer | Sale Price | Title Company |
|---|---|---|---|
| Lee Rick A | -- | -- | |
| Lee Rick A | -- | None Available | |
| Lee Rick A | $103,000 | None Available |
Source: Public Records
Mortgage History
| Date | Status | Borrower | Loan Amount |
|---|---|---|---|
| Previous Owner | Lee Rick A | $103,000 |
Source: Public Records
Tax History Compared to Growth
Tax History
| Year | Tax Paid | Tax Assessment Tax Assessment Total Assessment is a certain percentage of the fair market value that is determined by local assessors to be the total taxable value of land and additions on the property. | Land | Improvement |
|---|---|---|---|---|
| 2025 | $3,548 | $214,970 | $20,290 | $194,680 |
| 2024 | $3,548 | $187,320 | $18,120 | $169,200 |
| 2023 | $3,438 | $187,320 | $18,120 | $169,200 |
| 2022 | $3,018 | $152,330 | $14,380 | $137,950 |
| 2021 | $3,000 | $152,330 | $14,380 | $137,950 |
| 2020 | $3,000 | $140,530 | $13,070 | $127,460 |
| 2019 | $2,958 | $140,530 | $13,070 | $127,460 |
| 2018 | $2,832 | $136,980 | $13,070 | $123,910 |
| 2017 | $2,642 | $136,980 | $13,070 | $123,910 |
| 2016 | $2,598 | $126,550 | $7,780 | $118,770 |
| 2015 | $2,598 | $126,550 | $7,780 | $118,770 |
| 2014 | $2,650 | $126,550 | $7,780 | $118,770 |
Source: Public Records
Map
Nearby Homes
- 312 7th Ave NE
- 206 8th St SW
- 810 3rd Ave SW
- 519 3rd St SE
- 721 8th St SE
- 1020 6th Ave SW
- 406 6th Ave SW
- 513 4th St SW
- 2325 Jamestown Ave
- 812 1st St E
- 707 2nd St NE
- 611 3rd St NE
- 400 2nd St NW
- 206 7th Ave SW
- 523 Upper Terrace Dr
- 1606 Kellie Ave SW
- 111 Terrace Dr
- 507 2nd Ave NE
- 508 6th Ave NE
- 611 3rd Ave NE