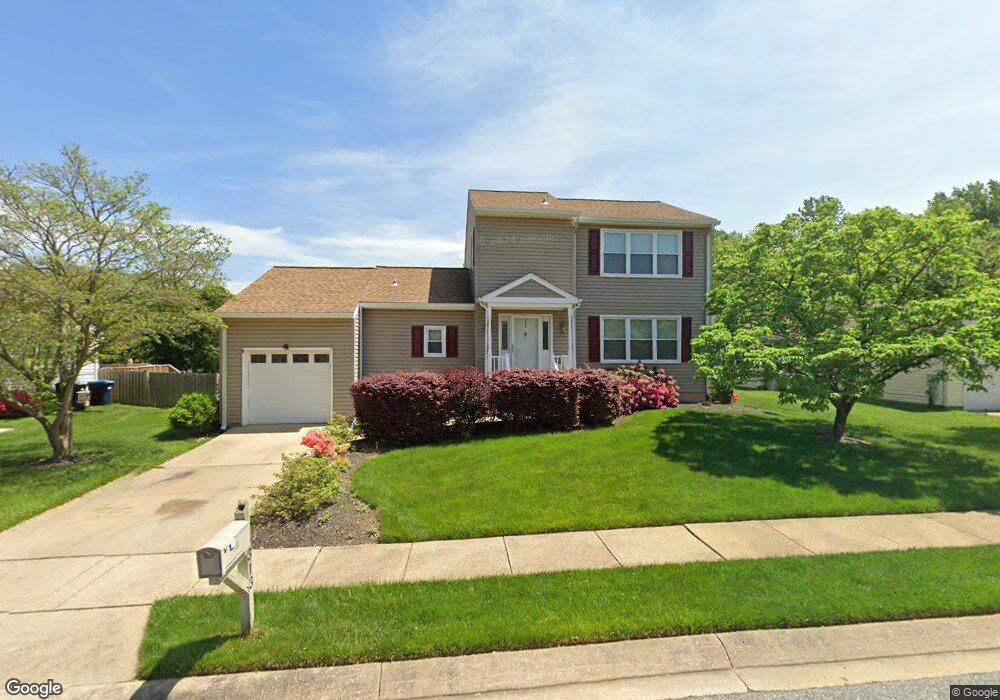
313 Barclay Ct Abingdon, MD 21009
Estimated Value: $387,859 - $437,000
--
Bed
3
Baths
1,772
Sq Ft
$236/Sq Ft
Est. Value
About This Home
This home is located at 313 Barclay Ct, Abingdon, MD 21009 and is currently estimated at $417,965, approximately $235 per square foot. 313 Barclay Ct is a home located in Harford County with nearby schools including Abingdon Elementary School, Edgewood Middle School, and Edgewood High School.
Ownership History
Date
Name
Owned For
Owner Type
Purchase Details
Closed on
Dec 1, 2004
Sold by
Caprinolo Antonio
Bought by
Caprinolo Antonio and Caprinolo Carina M
Current Estimated Value
Purchase Details
Closed on
May 29, 2003
Sold by
Antonelli Kevin M
Bought by
Caprinolo Antonio and Antonelli Carina M
Purchase Details
Closed on
Nov 6, 1987
Sold by
Noto Joseph F
Bought by
Antonelli Kevin M
Create a Home Valuation Report for This Property
The Home Valuation Report is an in-depth analysis detailing your home's value as well as a comparison with similar homes in the area
Home Values in the Area
Average Home Value in this Area
Purchase History
| Date | Buyer | Sale Price | Title Company |
|---|---|---|---|
| Caprinolo Antonio | -- | -- | |
| Caprinolo Antonio | -- | -- | |
| Antonelli Kevin M | $104,900 | -- |
Source: Public Records
Mortgage History
| Date | Status | Borrower | Loan Amount |
|---|---|---|---|
| Closed | Caprinolo Antonio | -- |
Source: Public Records
Tax History Compared to Growth
Tax History
| Year | Tax Paid | Tax Assessment Tax Assessment Total Assessment is a certain percentage of the fair market value that is determined by local assessors to be the total taxable value of land and additions on the property. | Land | Improvement |
|---|---|---|---|---|
| 2025 | $2,904 | $286,800 | $0 | $0 |
| 2024 | $2,904 | $266,400 | $0 | $0 |
| 2023 | $2,681 | $246,000 | $84,300 | $161,700 |
| 2022 | $2,592 | $237,833 | $0 | $0 |
| 2021 | $5,210 | $229,667 | $0 | $0 |
| 2020 | $2,556 | $221,500 | $84,300 | $137,200 |
| 2019 | $2,556 | $221,500 | $84,300 | $137,200 |
| 2018 | $2,533 | $221,500 | $84,300 | $137,200 |
| 2017 | $2,707 | $236,700 | $0 | $0 |
| 2016 | -- | $236,500 | $0 | $0 |
| 2015 | $2,873 | $236,300 | $0 | $0 |
| 2014 | $2,873 | $236,100 | $0 | $0 |
Source: Public Records
Map
Nearby Homes
- 3500 Thomas Pointe Ct Unit 2B
- 3506 Back Pointe Ct Unit 3D
- 3700 Denton Ct
- 3329 Midland Ct
- 203 Star Pointe Ct Unit 2C
- 203 Star Pointe Ct Unit 3C
- 201 Star Pointe Ct Unit 1A
- 627 Stone Mill Ct
- 625 N Branch Ct
- 3329 Betterton Cir
- 3334 Cheverly Ct
- 3359 Cheverly Ct
- 322 Delmar Ct
- 342 Overlea Place
- 329 Sunray Ct
- 3202 Uppercoe Ct
- 221 Glen View Terrace
- 3100 Ashton Ct
- 3305 Berlin Ct
- 3026 Cascade Dr
- 311 Barclay Ct
- 315 Barclay Ct
- 309 Barclay Ct
- 312 Aiken Terrace
- 310 Aiken Terrace
- 314 Aiken Terrace
- 308 Aiken Terrace
- 312 Barclay Ct
- 307 Barclay Ct
- 314 Barclay Ct
- 306 Aiken Terrace
- 308 Barclay Ct
- 305 Barclay Ct
- 304 Aiken Terrace
- 305 Crisfield Ct
- 311 Aiken Terrace
- 309 Aiken Terrace
- 307 Crisfield Ct
- 309 Crisfield Ct
- 313 Aiken Terrace