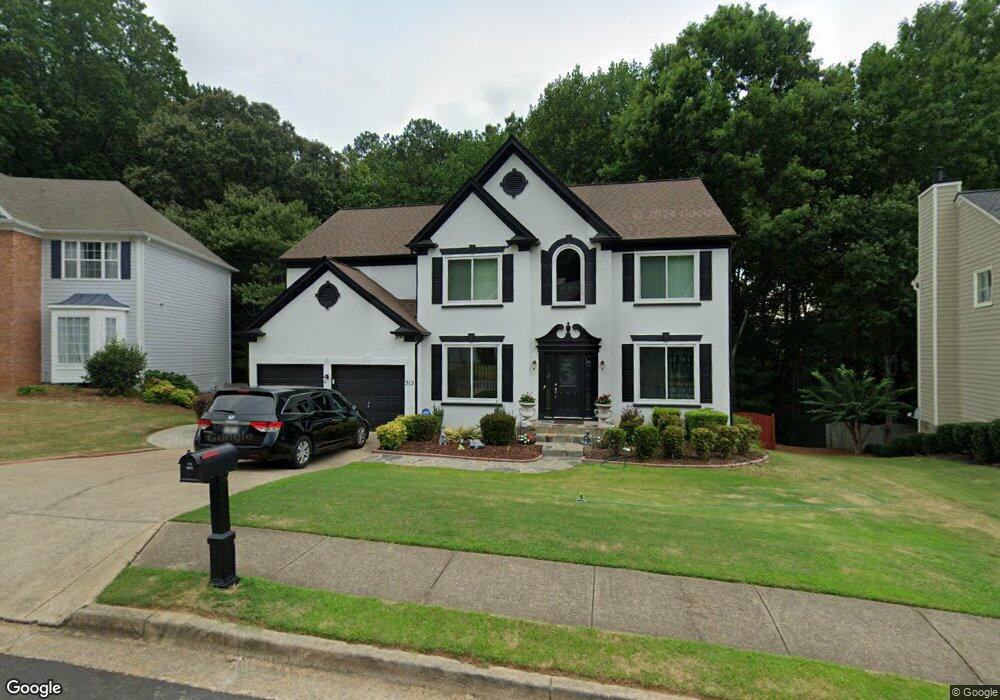
313 Bloombridge Way NW Unit 1 Marietta, GA 30066
Sandy Plains NeighborhoodEstimated Value: $444,000 - $487,000
4
Beds
3
Baths
2,523
Sq Ft
$186/Sq Ft
Est. Value
About This Home
This home is located at 313 Bloombridge Way NW Unit 1, Marietta, GA 30066 and is currently estimated at $470,442, approximately $186 per square foot. 313 Bloombridge Way NW Unit 1 is a home located in Cobb County with nearby schools including Chalker Elementary School, Daniell Middle School, and Sprayberry High School.
Ownership History
Date
Name
Owned For
Owner Type
Purchase Details
Closed on
Nov 2, 2007
Sold by
Khan Rehan A
Bought by
Khan Tehan A and Khan Fouzia
Current Estimated Value
Home Financials for this Owner
Home Financials are based on the most recent Mortgage that was taken out on this home.
Original Mortgage
$155,000
Outstanding Balance
$97,512
Interest Rate
6.27%
Mortgage Type
New Conventional
Estimated Equity
$372,930
Purchase Details
Closed on
Dec 30, 1998
Sold by
Kashi Roohullan Mahmoodza-Etal
Bought by
Mahmoodzaden Payam
Home Financials for this Owner
Home Financials are based on the most recent Mortgage that was taken out on this home.
Original Mortgage
$142,400
Interest Rate
6.77%
Mortgage Type
New Conventional
Purchase Details
Closed on
Jul 24, 1997
Sold by
Pulte Home Corp
Bought by
Kashi Roohullah M
Create a Home Valuation Report for This Property
The Home Valuation Report is an in-depth analysis detailing your home's value as well as a comparison with similar homes in the area
Home Values in the Area
Average Home Value in this Area
Purchase History
| Date | Buyer | Sale Price | Title Company |
|---|---|---|---|
| Khan Tehan A | $255,000 | -- | |
| Khan Rehan A | $255,000 | -- | |
| Mahmoodzaden Payam | $178,000 | -- | |
| Kashi Roohullah M | $177,300 | -- |
Source: Public Records
Mortgage History
| Date | Status | Borrower | Loan Amount |
|---|---|---|---|
| Open | Khan Rehan A | $155,000 | |
| Previous Owner | Mahmoodzaden Payam | $142,400 | |
| Closed | Kashi Roohullah M | -- |
Source: Public Records
Tax History Compared to Growth
Tax History
| Year | Tax Paid | Tax Assessment Tax Assessment Total Assessment is a certain percentage of the fair market value that is determined by local assessors to be the total taxable value of land and additions on the property. | Land | Improvement |
|---|---|---|---|---|
| 2024 | $4,721 | $195,900 | $38,000 | $157,900 |
| 2023 | $3,266 | $153,848 | $30,000 | $123,848 |
| 2022 | $3,838 | $153,848 | $30,000 | $123,848 |
| 2021 | $3,152 | $122,528 | $24,000 | $98,528 |
| 2020 | $3,152 | $122,528 | $24,000 | $98,528 |
| 2019 | $2,954 | $113,488 | $24,000 | $89,488 |
| 2018 | $2,954 | $113,488 | $24,000 | $89,488 |
| 2017 | $2,548 | $100,536 | $19,200 | $81,336 |
| 2016 | $2,550 | $100,536 | $19,200 | $81,336 |
| 2015 | $1,891 | $73,040 | $18,240 | $54,800 |
| 2014 | $1,908 | $73,040 | $0 | $0 |
Source: Public Records
Map
Nearby Homes
- 120 Chastain Rd NW Unit 1407
- 120 Chastain Rd NW Unit 202
- 138 Lakeside Dr NW
- 157 Eastlake Point NW
- 3321 Chastain Landings Ct
- 183 Kathryn Ln Unit 3
- 70 Cedar Valley Dr NE
- 127 N Lakeside Dr NW
- 159 Lloyd Dr
- 3157 Bellestone Ct
- 3784 Junction Dr NW
- 795 Weybourne Ct
- 799 Weybourne Ct
- 3819 Courson St
- 220 Vinca Cir NW
- 199 Vinca Cir NW
- 188 Vinca Cir NW
- 3418 Chastain Glen Ln NE
- 317 Bloombridge Way NW Unit 1
- 309 Bloombridge Way NW
- 321 Bloombridge Way NW Unit I
- 3518 Estates Landing Dr NW Unit 5
- 3518 Estates Landing Dr NW
- 305 Bloombridge Way NW Unit 1
- 312 Bloombridge Way NW
- 325 Bloombridge Way NW
- 316 Bloombridge Way NW
- 3526 Estates Landing Dr NW
- 3514 Estates Landing Dr NW
- 157 Rotherhithe Ln NW
- 0 Estates Landing Dr NW Unit 8086306
- 0 Estates Landing Dr NW Unit 7416968
- 161 Rotherhithe Ln NW
- 161 Rotherhithe Ln NW Unit 104
- 324 Bloombridge Way NW
- 153 Rotherhithe Ln NW
- 165 Rotherhithe Ln NW Unit 1
- 149 Rotherhithe Ln NW