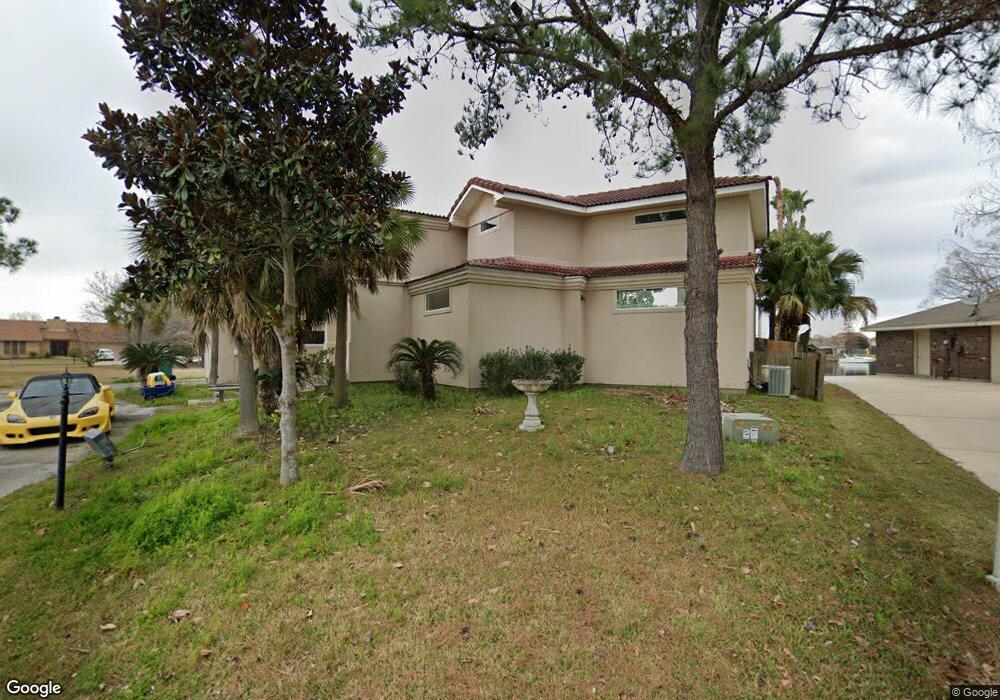
313 Charles Ct Slidell, LA 70458
Estimated Value: $460,000 - $633,000
4
Beds
4
Baths
4,260
Sq Ft
$128/Sq Ft
Est. Value
About This Home
This home is located at 313 Charles Ct, Slidell, LA 70458 and is currently estimated at $545,677, approximately $128 per square foot. 313 Charles Ct is a home located in St. Tammany Parish with nearby schools including W.L. Abney Elementary School, St. Tammany Junior High School, and Salmen High School.
Ownership History
Date
Name
Owned For
Owner Type
Purchase Details
Closed on
Aug 31, 2020
Sold by
Clinard Amy M and Bray Kristen N
Bought by
Maiwald Nathaniel E
Current Estimated Value
Purchase Details
Closed on
Aug 20, 2020
Sold by
Nguyen Long T and Dao Hong
Bought by
Pham Thuy T and Nguyen Hanh N
Purchase Details
Closed on
Nov 16, 2011
Sold by
Abramson Alfred
Bought by
Nguyen Hanh Ngoc and Pham Thuy Thi
Create a Home Valuation Report for This Property
The Home Valuation Report is an in-depth analysis detailing your home's value as well as a comparison with similar homes in the area
Home Values in the Area
Average Home Value in this Area
Purchase History
| Date | Buyer | Sale Price | Title Company |
|---|---|---|---|
| Maiwald Nathaniel E | -- | None Available | |
| Pham Thuy T | $247,950 | None Available | |
| Nguyen Hanh Ngoc | $247,950 | Title & Abstract Services Ll |
Source: Public Records
Tax History
| Year | Tax Paid | Tax Assessment Tax Assessment Total Assessment is a certain percentage of the fair market value that is determined by local assessors to be the total taxable value of land and additions on the property. | Land | Improvement |
|---|---|---|---|---|
| 2025 | $7,355 | $58,241 | $4,800 | $53,441 |
| 2024 | $7,355 | $58,241 | $4,800 | $53,441 |
| 2023 | $7,656 | $45,253 | $4,000 | $41,253 |
| 2022 | $658,528 | $45,253 | $4,000 | $41,253 |
| 2021 | $6,576 | $45,253 | $4,000 | $41,253 |
| 2020 | $5,465 | $45,253 | $4,000 | $41,253 |
| 2019 | $6,132 | $40,857 | $4,000 | $36,857 |
| 2018 | $6,156 | $40,857 | $4,000 | $36,857 |
| 2017 | $6,196 | $40,857 | $4,000 | $36,857 |
| 2016 | $6,340 | $40,857 | $4,000 | $36,857 |
| 2015 | $4,474 | $35,461 | $6,000 | $29,461 |
| 2014 | $4,389 | $35,461 | $6,000 | $29,461 |
| 2013 | -- | $35,461 | $6,000 | $29,461 |
Source: Public Records
Map
Nearby Homes
- 106 Eydie Ln
- 409 Charles Ct
- 117 Windward Passage St
- 302 Charles Ct
- 212 Eydie Ln
- 118 Windward Passage St
- 222 Windward Passage St
- 310 Windward Passage St
- 301 Windward Passage St
- 311 Windward Passage St
- 205 Windward Passage St
- 119 Ondine Ln
- 111 Columbia Place
- 103 Gretel Cove
- 164 Marina Dr
- 172 Marina Dr
- 301 Windward Passage None
Your Personal Tour Guide
Ask me questions while you tour the home.