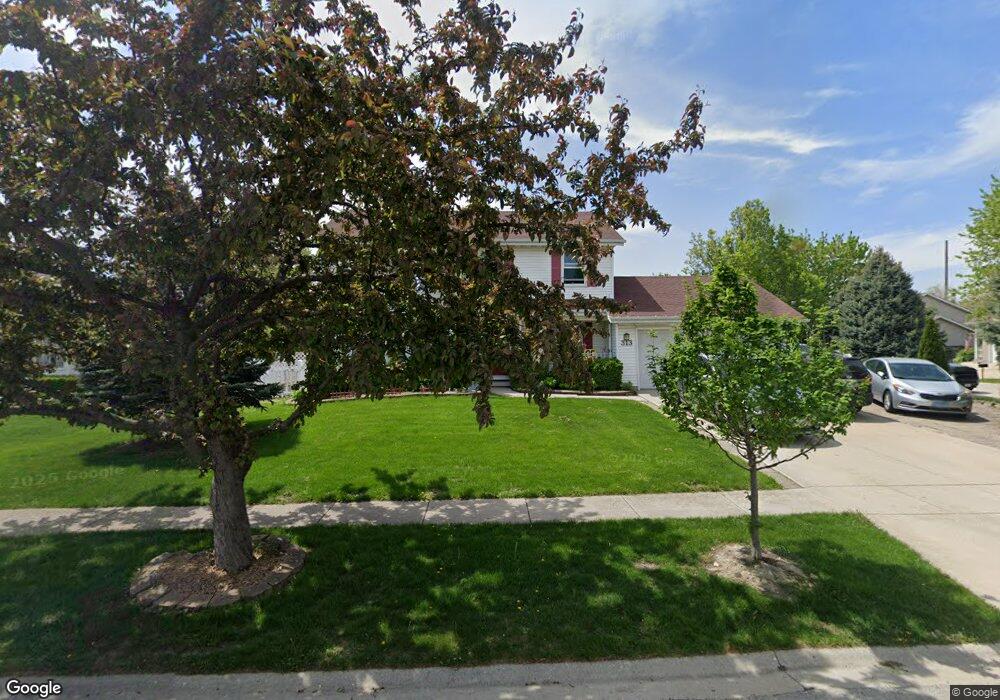
313 Chippewa Dr Minooka, IL 60447
Estimated Value: $328,000 - $390,337
Studio
--
Bath
2,032
Sq Ft
$181/Sq Ft
Est. Value
About This Home
This home is located at 313 Chippewa Dr, Minooka, IL 60447 and is currently estimated at $367,834, approximately $181 per square foot. 313 Chippewa Dr is a home with nearby schools including Minooka Primary Center, Minooka Elementary School, and Minooka Junior High School.
Create a Home Valuation Report for This Property
The Home Valuation Report is an in-depth analysis detailing your home's value as well as a comparison with similar homes in the area
Tax History
| Year | Tax Paid | Tax Assessment Tax Assessment Total Assessment is a certain percentage of the fair market value that is determined by local assessors to be the total taxable value of land and additions on the property. | Land | Improvement |
|---|---|---|---|---|
| 2024 | $9,511 | $118,577 | $19,138 | $99,439 |
| 2023 | $8,670 | $108,082 | $17,444 | $90,638 |
| 2022 | $7,580 | $100,494 | $16,219 | $84,275 |
| 2021 | $7,260 | $95,129 | $15,353 | $79,776 |
| 2020 | $7,084 | $91,000 | $14,687 | $76,313 |
| 2019 | $7,155 | $89,668 | $13,766 | $75,902 |
| 2018 | $7,245 | $88,665 | $13,612 | $75,053 |
| 2017 | $7,038 | $84,668 | $12,998 | $71,670 |
| 2016 | $6,579 | $79,478 | $12,201 | $67,277 |
| 2015 | $5,485 | $72,246 | $11,091 | $61,155 |
| 2014 | $4,919 | $68,260 | $10,479 | $57,781 |
| 2013 | $5,055 | $69,180 | $10,620 | $58,560 |
Source: Public Records
Map
Nearby Homes
- 605 Davidson Dr Unit B
- 300 Arrowhead Dr
- 307 Illini Dr
- 108 Deerpath Dr
- 208 N Wabena Ave
- 103 E Saint Marys St
- 405 W Mondamin St
- 500 Rivers Edge Dr
- 517 Rivers Edge Dr
- 103 Northfield Dr
- 302 Grande Dr Unit C
- 105 Northfield Dr
- LOT 1 Bob Blair Rd
- VL Mcevilly Rd
- 9015 E Mcevilly Rd
- 208 Santos Ave
- 502 Kilheeney Dr
- 607 Flanagan Dr Unit B
- 704 Camden Dr
- 702 Longwood Ct
- 511 Davidson Dr Unit A
- 511 Davidson Dr Unit B
- 509 Davidson Dr
- 507 Davidson Dr
- 513 Davidson Dr Unit A
- 513 Davidson Dr Unit B
- 505 Davidson Dr Unit 2
- 505 Davidson Dr
- 324 Arrowhead Dr
- 419 Davidson Dr
- 503 Davidson Dr
- 503 Davidson Dr Unit 2
- 603 Davidson Dr Unit B
- 603 Davidson Dr Unit A
- 311 Chippewa Dr
- 405 Davidson Dr
- 314 Chippewa Dr
- 409 Davidson Dr
- 415 Davidson Dr
- 320 Arrowhead Dr
Your Personal Tour Guide
Ask me questions while you tour the home.