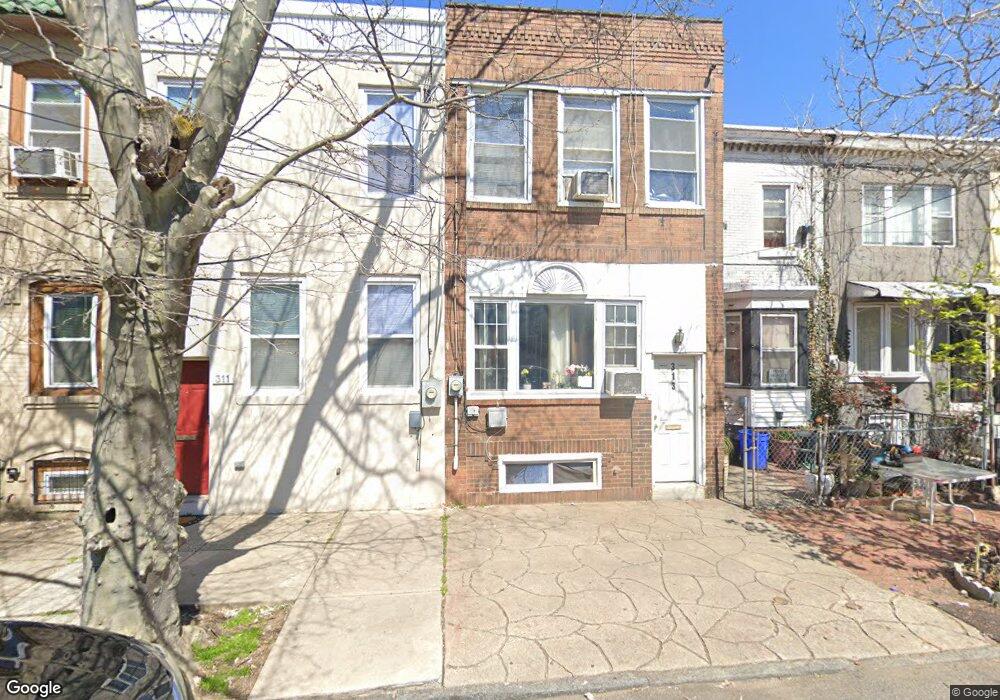
313 Clinton St Camden, NJ 08103
Lanning Square NeighborhoodEstimated Value: $89,629 - $167,000
--
Bed
--
Bath
1,264
Sq Ft
$97/Sq Ft
Est. Value
About This Home
This home is located at 313 Clinton St, Camden, NJ 08103 and is currently estimated at $122,157, approximately $96 per square foot. 313 Clinton St is a home located in Camden County with nearby schools including Camden High School, Hope Community Charter School, and Leap Academy University Charter School.
Ownership History
Date
Name
Owned For
Owner Type
Purchase Details
Closed on
Dec 21, 2015
Sold by
Rosado Antonio
Bought by
Rosados Morgan Market Llc
Current Estimated Value
Purchase Details
Closed on
Nov 25, 2014
Sold by
Rosado Jose Ramon
Bought by
Rosado Antonio
Purchase Details
Closed on
Nov 8, 2010
Sold by
Rosado Antonio
Bought by
Rosado Jose Ramon
Purchase Details
Closed on
Dec 7, 2009
Sold by
Delvalle Jose L
Bought by
Rosado Antonio
Purchase Details
Closed on
Mar 21, 2009
Sold by
Villafane Sonia
Bought by
Delvalle Jose L
Purchase Details
Closed on
Mar 12, 2002
Sold by
Valle Lucia Del
Bought by
Villafane Sonia
Purchase Details
Closed on
Jul 24, 1997
Sold by
Torres Vincente
Bought by
Delvalle Lucia
Create a Home Valuation Report for This Property
The Home Valuation Report is an in-depth analysis detailing your home's value as well as a comparison with similar homes in the area
Home Values in the Area
Average Home Value in this Area
Purchase History
| Date | Buyer | Sale Price | Title Company |
|---|---|---|---|
| Rosados Morgan Market Llc | -- | None Available | |
| Rosado Antonio | -- | None Available | |
| Rosado Jose Ramon | -- | -- | |
| Rosado Antonio | -- | -- | |
| Delvalle Jose L | -- | -- | |
| Villafane Sonia | $6,000 | -- | |
| Delvalle Lucia | $13,000 | -- |
Source: Public Records
Tax History Compared to Growth
Tax History
| Year | Tax Paid | Tax Assessment Tax Assessment Total Assessment is a certain percentage of the fair market value that is determined by local assessors to be the total taxable value of land and additions on the property. | Land | Improvement |
|---|---|---|---|---|
| 2025 | $1,113 | $31,400 | $5,800 | $25,600 |
| 2024 | $1,075 | $31,400 | $5,800 | $25,600 |
| 2023 | $1,075 | $31,400 | $5,800 | $25,600 |
| 2022 | $1,055 | $31,400 | $5,800 | $25,600 |
| 2021 | $1,052 | $31,400 | $5,800 | $25,600 |
| 2020 | $999 | $31,400 | $5,800 | $25,600 |
| 2019 | $956 | $31,400 | $5,800 | $25,600 |
| 2018 | $951 | $31,400 | $5,800 | $25,600 |
| 2017 | $928 | $31,400 | $5,800 | $25,600 |
| 2016 | $898 | $31,400 | $5,800 | $25,600 |
| 2015 | $865 | $31,400 | $5,800 | $25,600 |
| 2014 | $844 | $31,400 | $5,800 | $25,600 |
Source: Public Records
Map
Nearby Homes