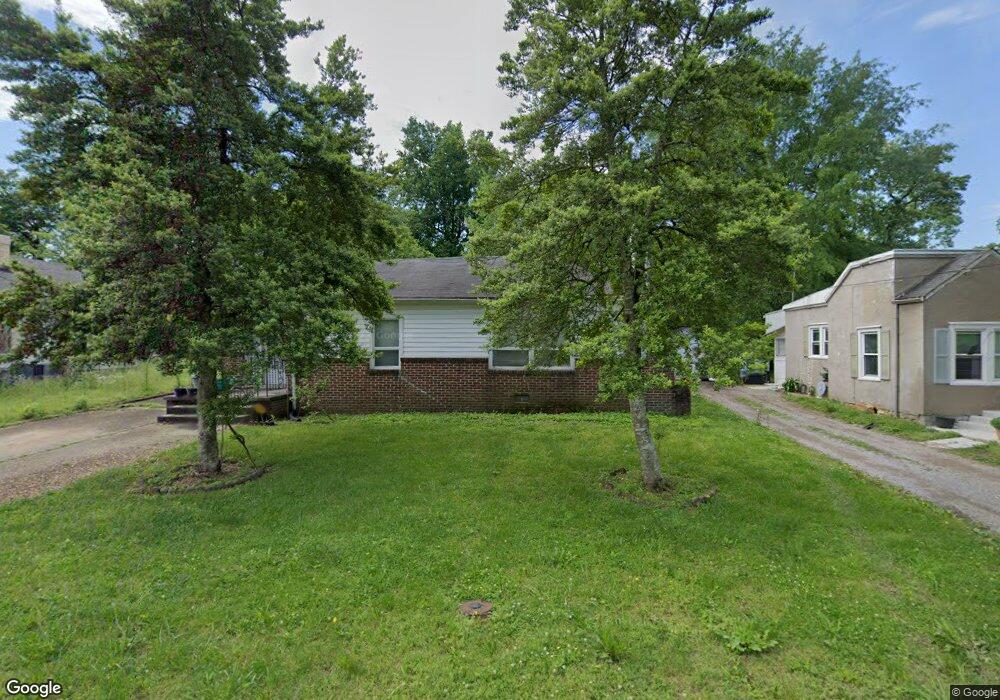
313 Colonial Ave Shelbyville, TN 37160
Estimated Value: $186,000 - $306,000
3
Beds
2
Baths
2,066
Sq Ft
$114/Sq Ft
Est. Value
About This Home
This home is located at 313 Colonial Ave, Shelbyville, TN 37160 and is currently estimated at $235,729, approximately $114 per square foot. 313 Colonial Ave is a home located in Bedford County with nearby schools including South Side Elementary School, Harris Middle School, and Christian Chapel Academy.
Ownership History
Date
Name
Owned For
Owner Type
Purchase Details
Closed on
May 27, 2017
Sold by
Holder Amanda M
Bought by
Weinans-Iseli Susan Rae
Current Estimated Value
Home Financials for this Owner
Home Financials are based on the most recent Mortgage that was taken out on this home.
Original Mortgage
$62,331
Outstanding Balance
$51,722
Interest Rate
4.02%
Mortgage Type
New Conventional
Estimated Equity
$184,007
Purchase Details
Closed on
Jan 26, 2007
Sold by
Wright Joyce M
Bought by
Hilton Amanda M
Purchase Details
Closed on
Sep 19, 2005
Sold by
Hickman David
Bought by
Wright Joyce M
Purchase Details
Closed on
Apr 4, 2000
Bought by
Hickman David %Franklin American Mort Co
Purchase Details
Closed on
Jul 29, 1996
Sold by
Gentry Alva
Bought by
Hickson William and Hickson Kelly
Purchase Details
Closed on
Jul 27, 1937
Bought by
Gentry Alva and Gentry Beulah
Create a Home Valuation Report for This Property
The Home Valuation Report is an in-depth analysis detailing your home's value as well as a comparison with similar homes in the area
Home Values in the Area
Average Home Value in this Area
Purchase History
| Date | Buyer | Sale Price | Title Company |
|---|---|---|---|
| Weinans-Iseli Susan Rae | $78,900 | -- | |
| Hilton Amanda M | $89,500 | -- | |
| Wright Joyce M | $76,900 | -- | |
| Hickman David %Franklin American Mort Co | $55,700 | -- | |
| Hickson William | $45,000 | -- | |
| Gentry Alva | -- | -- |
Source: Public Records
Mortgage History
| Date | Status | Borrower | Loan Amount |
|---|---|---|---|
| Open | Weinans-Iseli Susan Rae | $62,331 |
Source: Public Records
Tax History Compared to Growth
Tax History
| Year | Tax Paid | Tax Assessment Tax Assessment Total Assessment is a certain percentage of the fair market value that is determined by local assessors to be the total taxable value of land and additions on the property. | Land | Improvement |
|---|---|---|---|---|
| 2025 | -- | $30,775 | $0 | $0 |
| 2024 | -- | $30,775 | $3,225 | $27,550 |
| 2023 | $1,171 | $30,775 | $3,225 | $27,550 |
| 2022 | $1,205 | $30,775 | $3,225 | $27,550 |
| 2021 | $1,094 | $30,775 | $3,225 | $27,550 |
| 2020 | $786 | $30,775 | $3,225 | $27,550 |
| 2019 | $786 | $17,750 | $2,500 | $15,250 |
| 2018 | $768 | $17,750 | $2,500 | $15,250 |
| 2017 | $768 | $17,750 | $2,500 | $15,250 |
| 2016 | $761 | $17,750 | $2,500 | $15,250 |
| 2015 | $761 | $17,750 | $2,500 | $15,250 |
| 2014 | $704 | $17,963 | $0 | $0 |
Source: Public Records
Map
Nearby Homes
- 315 Colonial Ave
- 311 Colonial Ave
- 804 Cowan Ave
- 309 Colonial Ave
- 319 Colonial Ave
- 314 Colonial Ave
- 806 Cowan Ave
- 316 Colonial Ave
- 306 Colonial Ave
- 803 Cowan Ave
- 321 Colonial Ave
- 805 Cowan Ave
- 302 Colonial Ave
- 807 Cowan Ave
- 324 Colonial Ave
- 325 Colonial Ave
- 900 Cowan Ave
- 314 Charlotte Dr
- 901 Cowan Ave
- 902 Cowan Ave