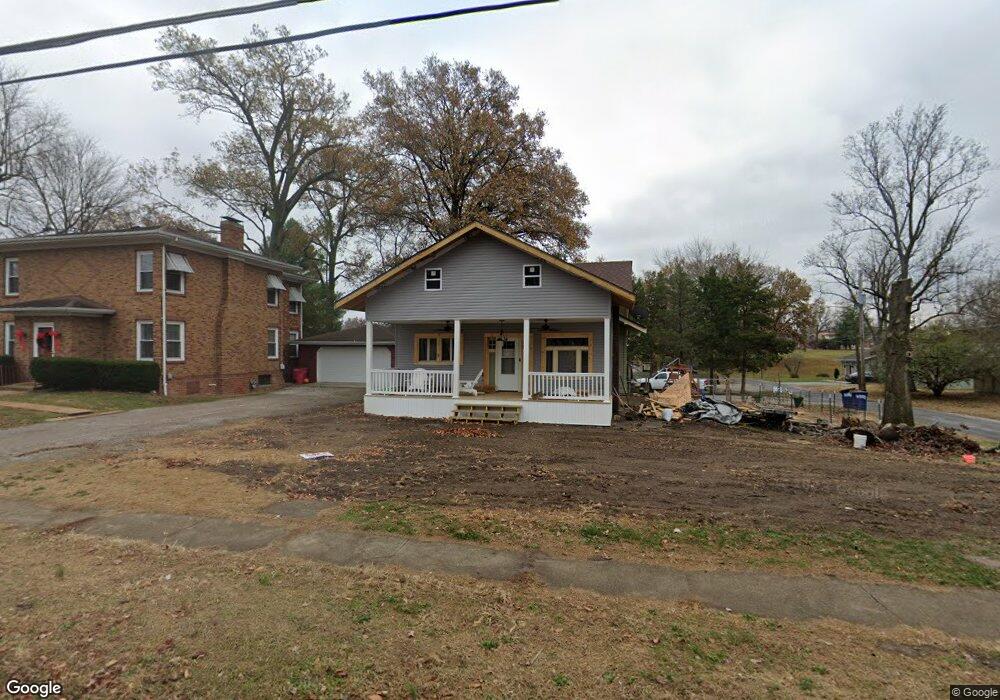
313 E North St Du Quoin, IL 62832
Estimated Value: $86,000 - $101,000
3
Beds
1
Bath
1,232
Sq Ft
$77/Sq Ft
Est. Value
About This Home
This home is located at 313 E North St, Du Quoin, IL 62832 and is currently estimated at $94,299, approximately $76 per square foot. 313 E North St is a home located in Perry County with nearby schools including DuQuoin High School, DuQuoin Elementary School, and DuQuoin Middle School.
Ownership History
Date
Name
Owned For
Owner Type
Purchase Details
Closed on
Jan 20, 2021
Sold by
Livisa Llc
Bought by
Morgenstern Douglas R and Morgenstern Marsha D
Current Estimated Value
Home Financials for this Owner
Home Financials are based on the most recent Mortgage that was taken out on this home.
Original Mortgage
$50,053
Outstanding Balance
$37,062
Interest Rate
4%
Mortgage Type
New Conventional
Estimated Equity
$57,237
Purchase Details
Closed on
Jul 30, 2014
Sold by
Phillips Jeffrey K and Phillips Billie R
Bought by
Revocable Trust Of Jeffrey Kent Phillips
Purchase Details
Closed on
Sep 28, 2012
Sold by
Grosse Nancy Dale and Kuhnert Dianna Dean
Bought by
Phillips Billie R
Create a Home Valuation Report for This Property
The Home Valuation Report is an in-depth analysis detailing your home's value as well as a comparison with similar homes in the area
Home Values in the Area
Average Home Value in this Area
Purchase History
| Date | Buyer | Sale Price | Title Company |
|---|---|---|---|
| Morgenstern Douglas R | $62,566 | None Listed On Document | |
| Revocable Trust Of Jeffrey Kent Phillips | -- | None Available | |
| Phillips Billie R | $44,000 | None Available |
Source: Public Records
Mortgage History
| Date | Status | Borrower | Loan Amount |
|---|---|---|---|
| Open | Morgenstern Douglas R | $50,053 |
Source: Public Records
Tax History
| Year | Tax Paid | Tax Assessment Tax Assessment Total Assessment is a certain percentage of the fair market value that is determined by local assessors to be the total taxable value of land and additions on the property. | Land | Improvement |
|---|---|---|---|---|
| 2024 | $1,406 | $23,581 | $2,906 | $20,675 |
| 2023 | $1,804 | $22,322 | $2,751 | $19,571 |
| 2022 | $1,876 | $20,359 | $2,509 | $17,850 |
| 2021 | $1,879 | $19,095 | $2,353 | $16,742 |
| 2020 | $1,706 | $17,669 | $2,177 | $15,492 |
| 2019 | $1,665 | $17,155 | $2,114 | $15,041 |
| 2018 | $1,665 | $17,155 | $2,114 | $15,041 |
| 2017 | $1,681 | $17,217 | $2,122 | $15,095 |
| 2016 | $1,665 | $16,836 | $2,075 | $14,761 |
| 2015 | $1,665 | $16,836 | $2,075 | $14,761 |
| 2013 | $1,652 | $16,520 | $2,036 | $14,484 |
Source: Public Records
Map
Nearby Homes
- 335 E North St
- 402 E Keyes St
- 401 N Division St Unit A & B
- 12 N Division St
- 20 S Peach St
- 540 E Main St
- 532 N Washington St
- 6 S Division St
- 210 & 214 N Oak St
- 113 N Hickory St
- 732 E Park St
- 115 S Hickory St
- 501 S Washington St
- 209 S Walnut St
- 310 S Illinois Ave
- 419 W Main St
- 821 Bluebell Rd
- 209 W Franklin St
- 507 W Main St
- 904 E Poplar St
Your Personal Tour Guide
Ask me questions while you tour the home.