
Seller's Agent in 2017
Maria Crespo
Keller Williams Realty
(413) 426-6901
17 in this area
39 Total Sales


Estimated Value: $439,599
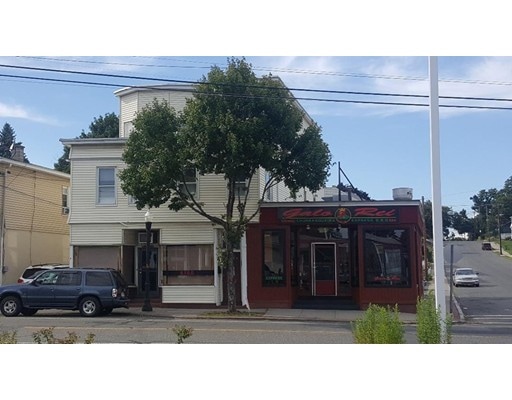
Looking to generate income? Great Opportunity for the investor in this prime downtown Ludlow Location! This property features a mixed-use Residential & Commercial building with one or two storefronts, now being used as the Galo Rei restaurant. 3 room 1 bedroom apartment on the first floor. Second-floor apartment with 7 rooms 3 bedrooms. Third-floor is also quite large 6 rooms 2 bedrooms. SEPARATE UTILITIES. Town water and sewer, Gas heat, central air on the second-floor unit and the restaurant. A multi-unit property with 3 car detached garage spaces! Prime location, highway access & shopping district, this building will attract residential tenants and/or business owners!
Last Buyer's Agent
Berkshire Hathaway HomeServices Realty Professionals License #452508530
Home Type
Multi-Family
Est. Annual Taxes
$5,439
Lot Details
0
| Date | Buyer | Sale Price | Title Company |
|---|---|---|---|
| Karakartal 28 Llc | $650,000 | -- | |
| New England Equities L | $264,500 | -- |
| Date | Status | Borrower | Loan Amount |
|---|---|---|---|
| Open | Karakartal 28 Llc | $487,500 | |
| Previous Owner | New England Equities L | $229,600 |
| Date | Event | Price | List to Sale | Price per Sq Ft |
|---|---|---|---|---|
| 11/29/2017 11/29/17 | Sold | $264,500 | -1.7% | $56 / Sq Ft |
| 10/03/2017 10/03/17 | Pending | -- | -- | -- |
| 09/21/2017 09/21/17 | For Sale | $269,000 | -- | $57 / Sq Ft |
| Year | Tax Paid | Tax Assessment Tax Assessment Total Assessment is a certain percentage of the fair market value that is determined by local assessors to be the total taxable value of land and additions on the property. | Land | Improvement |
|---|---|---|---|---|
| 2025 | $5,439 | $313,500 | $131,700 | $181,800 |
| 2024 | $5,481 | $303,000 | $121,200 | $181,800 |
| 2023 | $5,049 | $258,800 | $110,200 | $148,600 |
| 2022 | $5,089 | $254,600 | $110,200 | $144,400 |
| 2021 | $5,209 | $247,100 | $106,900 | $140,200 |
| 2020 | $5,091 | $246,900 | $105,400 | $141,500 |
| 2019 | $4,832 | $243,800 | $102,300 | $141,500 |
| 2018 | $3,085 | $162,300 | $102,300 | $60,000 |
| 2017 | $2,989 | $161,300 | $99,400 | $61,900 |
| 2016 | $2,926 | $161,400 | $97,400 | $64,000 |
| 2015 | $2,808 | $162,400 | $96,500 | $65,900 |
Seller's Agent in 2017
Maria Crespo
Keller Williams Realty
(413) 426-6901
17 in this area
39 Total Sales
Buyer's Agent in 2017
Rebecca Kingston
Berkshire Hathaway HomeServices Realty Professionals
(413) 519-6787
1 in this area
155 Total Sales
Source: MLS Property Information Network (MLS PIN)
MLS Number: 72232439
APN: LUDL-150490-000000-A000338
Disclaimer: Certain information contained herein is derived from information provided by parties other than Homes.com. All information provided is deemed reliable, but is not guaranteed to be accurate and should be independently verified.
![]() The property listing data and information, or the Images, set forth herein were provided to MLS Property Information Network, Inc. from third party sources, including sellers, lessors and public records, and were compiled by MLS Property Information Network, Inc. The property listing data and information, and the Images, are for the personal, non-commercial use of consumers having a good faith interest in purchasing or leasing listed properties of the type displayed to them and may not be used for any purpose other than to identify prospective properties which such consumers may have a good faith interest in purchasing or leasing. MLS Property Information Network, Inc. and its subscribers disclaim any and all representations and warranties as to the accuracy of the property listing data and information, or as to the accuracy of any of the Images, set forth herein.
The property listing data and information, or the Images, set forth herein were provided to MLS Property Information Network, Inc. from third party sources, including sellers, lessors and public records, and were compiled by MLS Property Information Network, Inc. The property listing data and information, and the Images, are for the personal, non-commercial use of consumers having a good faith interest in purchasing or leasing listed properties of the type displayed to them and may not be used for any purpose other than to identify prospective properties which such consumers may have a good faith interest in purchasing or leasing. MLS Property Information Network, Inc. and its subscribers disclaim any and all representations and warranties as to the accuracy of the property listing data and information, or as to the accuracy of any of the Images, set forth herein.