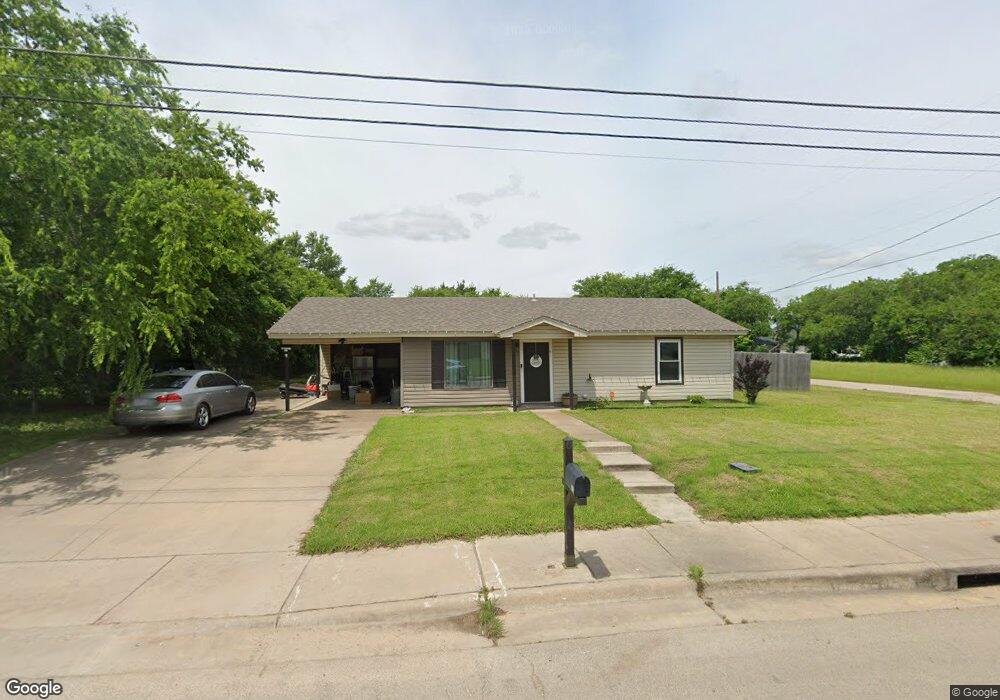
313 Elmo St Cleburne, TX 76031
Estimated Value: $157,000 - $277,000
2
Beds
1
Bath
1,064
Sq Ft
$178/Sq Ft
Est. Value
About This Home
This home is located at 313 Elmo St, Cleburne, TX 76031 and is currently estimated at $189,436, approximately $178 per square foot. 313 Elmo St is a home located in Johnson County with nearby schools including Irving Elementary School, A.D. Wheat Middle School, and Cleburne High School.
Ownership History
Date
Name
Owned For
Owner Type
Purchase Details
Closed on
Apr 19, 2019
Sold by
Anderson Bonnie
Bought by
Swanson Tamara
Current Estimated Value
Home Financials for this Owner
Home Financials are based on the most recent Mortgage that was taken out on this home.
Original Mortgage
$108,007
Outstanding Balance
$96,236
Interest Rate
4.99%
Mortgage Type
FHA
Estimated Equity
$93,200
Purchase Details
Closed on
Sep 25, 2008
Sold by
West Irma White
Bought by
Anderson Bonnie
Home Financials for this Owner
Home Financials are based on the most recent Mortgage that was taken out on this home.
Original Mortgage
$66,801
Interest Rate
6.46%
Mortgage Type
FHA
Create a Home Valuation Report for This Property
The Home Valuation Report is an in-depth analysis detailing your home's value as well as a comparison with similar homes in the area
Home Values in the Area
Average Home Value in this Area
Purchase History
| Date | Buyer | Sale Price | Title Company |
|---|---|---|---|
| Swanson Tamara | -- | Independence Title | |
| Anderson Bonnie | -- | Stnt |
Source: Public Records
Mortgage History
| Date | Status | Borrower | Loan Amount |
|---|---|---|---|
| Open | Swanson Tamara | $108,007 | |
| Previous Owner | Anderson Bonnie | $66,801 |
Source: Public Records
Tax History
| Year | Tax Paid | Tax Assessment Tax Assessment Total Assessment is a certain percentage of the fair market value that is determined by local assessors to be the total taxable value of land and additions on the property. | Land | Improvement |
|---|---|---|---|---|
| 2025 | $1,430 | $131,262 | $43,000 | $88,262 |
| 2024 | $2,741 | $122,938 | $0 | $0 |
| 2023 | $1,187 | $111,762 | $23,500 | $88,262 |
| 2022 | $2,797 | $111,762 | $23,500 | $88,262 |
| 2021 | $2,673 | $111,762 | $23,500 | $88,262 |
| 2020 | $2,581 | $93,138 | $20,000 | $73,138 |
| 2019 | $1,875 | $93,138 | $20,000 | $73,138 |
| 2018 | $1,705 | $57,677 | $10,500 | $47,177 |
| 2017 | $1,698 | $57,677 | $10,500 | $47,177 |
| 2016 | $1,698 | $57,677 | $10,500 | $47,177 |
Source: Public Records
Map
Nearby Homes
Your Personal Tour Guide
Ask me questions while you tour the home.