313 Gray Rd Gorham, ME 04038
Gorham AreaEstimated Value: $422,000 - $556,000
About This Home
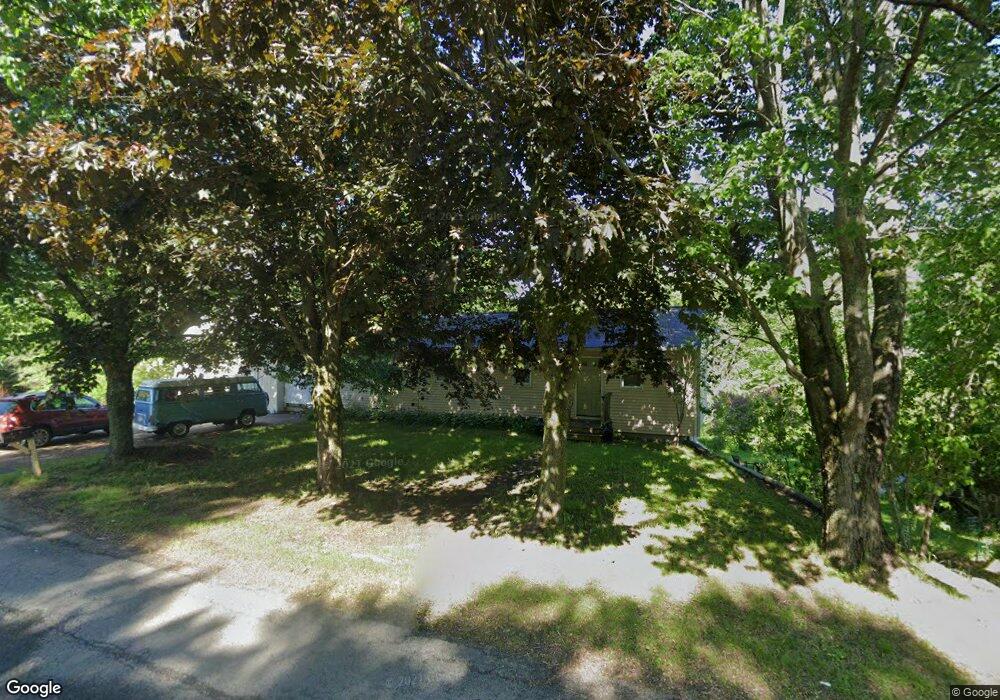
This home is located at 313 Gray Rd, Gorham, ME 04038 and is currently estimated at $464,601, approximately $420 per square foot. 313 Gray Rd is a home located in Cumberland County with nearby schools including Great Falls Elementary School, Gorham Middle School, and Gorham High School.
Ownership History
We collect this data history from publicly available records. To have your information removed, we recommend requesting removal directly through your county’s website.
Purchase Details
Home Financials for this Owner
Home Financials are based on the most recent Mortgage that was taken out on this home.Purchase Details
Home Financials for this Owner
Home Financials are based on the most recent Mortgage that was taken out on this home.Home Values in the Area
Average Home Value in this Area
Purchase History
We collect this data history from publicly available records. To have your information removed, we recommend requesting removal directly through your county’s website.
| Date | Buyer | Sale Price | Title Company |
|---|---|---|---|
| -- | -- | ||
| -- | -- | ||
| -- | -- |
Mortgage History
We collect this data history from publicly available records. To have your information removed, we recommend requesting removal directly through your county’s website.
| Date | Status | Borrower | Loan Amount |
|---|---|---|---|
| Open | $125,000 | ||
| Closed | $177,600 | ||
| Closed | $159,000 | ||
| Closed | $20,000 | ||
| Closed | $118,808 | ||
| Previous Owner | $1,090,000 | ||
| Previous Owner | $1,090,000 | ||
| Previous Owner | $235,000 | ||
| Previous Owner | $110,000 | ||
| Closed | $91,699 |
Tax History
We collect this data history from publicly available records. To have your information removed, we recommend requesting removal directly through your county’s website.
| Year | Tax Paid | Tax Assessment Tax Assessment Total Assessment is a certain percentage of the fair market value that is determined by local assessors to be the total taxable value of land and additions on the property. | Land | Improvement |
|---|---|---|---|---|
| 2025 | $4,350 | $293,900 | $74,400 | $219,500 |
| 2024 | $4,320 | $293,900 | $74,400 | $219,500 |
| 2023 | $4,041 | $293,900 | $74,400 | $219,500 |
| 2022 | $3,752 | $292,000 | $74,400 | $217,600 |
| 2021 | $3,098 | $159,700 | $57,600 | $102,100 |
| 2020 | $3,034 | $159,700 | $57,600 | $102,100 |
| 2019 | $3,026 | $159,700 | $57,600 | $102,100 |
| 2018 | $2,907 | $159,700 | $57,600 | $102,100 |
| 2017 | $2,731 | $159,700 | $57,600 | $102,100 |
| 2016 | $2,720 | $160,000 | $57,900 | $102,100 |
| 2015 | $3,099 | $190,100 | $88,000 | $102,100 |
| 2014 | $3,134 | $180,100 | $78,100 | $102,000 |
| 2013 | $3,228 | $186,600 | $84,600 | $102,000 |
Map
- 35 Longmeadow Dr
- 23 Queen St
- 0 Libby Ave
- 114 Harding Bridge Rd
- 315 River Rd
- 42 Main St
- 41 Main St
- 110 Gordon Farms Rd
- 105 Gateway Commons Dr
- 16 Apple Ln
- 387 Mosher Rd
- 11 Valley View Dr
- 32 Fairway Commons Dr Unit 11
- 14 Oliver Ln
- 62 Chute Rd
- 23 Pennywhistle Dr
- 0 Cobb Rd
- 32 Pennywhistle Dr
- 22 Montgomery Rd
- 9 Gunpowder Mill Rd
Ask me questions while you tour the home.