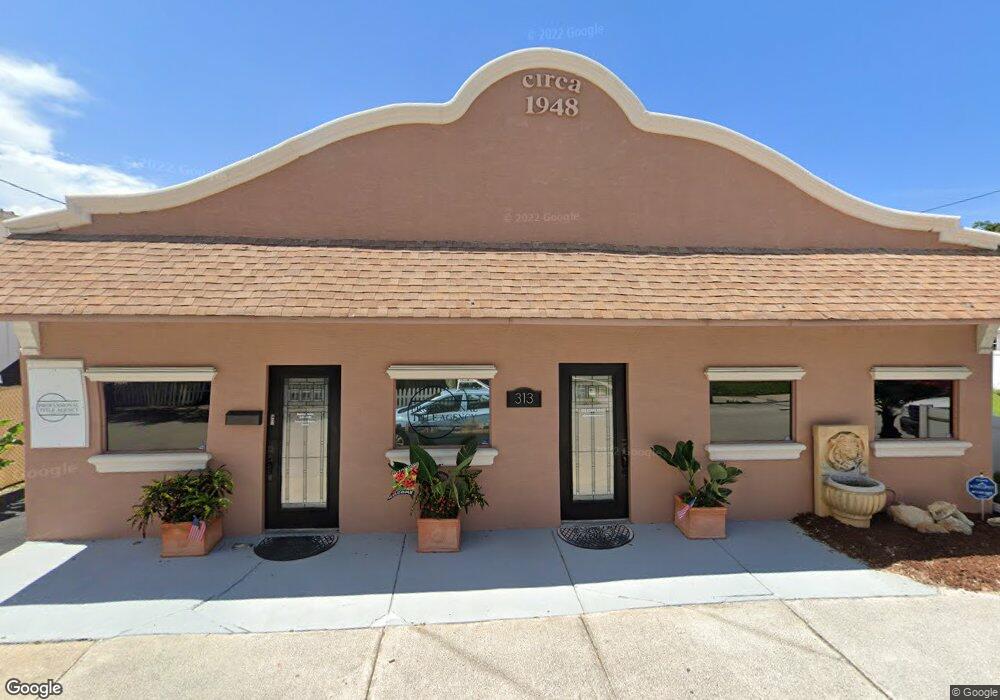
313 Julia St New Smyrna Beach, FL 32168
Canal Downtown NeighborhoodEstimated Value: $415,535
--
Bed
2
Baths
2,400
Sq Ft
$173/Sq Ft
Est. Value
About This Home
This home is located at 313 Julia St, New Smyrna Beach, FL 32168 and is currently estimated at $415,535, approximately $173 per square foot. 313 Julia St is a home located in Volusia County with nearby schools including Chisholm Elementary School, New Smyrna Beach Middle School, and Knight's Christian Academy.
Ownership History
Date
Name
Owned For
Owner Type
Purchase Details
Closed on
Mar 7, 2025
Sold by
Rittger Herbert C and Rittger Susan C
Bought by
Rittger Herbert C and Rittger Susan C
Current Estimated Value
Purchase Details
Closed on
Nov 7, 2019
Sold by
Rittger Herbert C and Rittger Suan C
Bought by
Rittger Herbert C and Rittger Susan C
Purchase Details
Closed on
Sep 18, 2015
Sold by
Rittger Susan C
Bought by
Rittger Herbert C and Rittger Susan C
Purchase Details
Closed on
Jul 15, 2004
Sold by
Ethridge James S and Ethridge Blythe
Bought by
Rittger Susan C
Purchase Details
Closed on
Jan 31, 2003
Sold by
Bailey Robert H
Bought by
Ethridge James S and Ethridge Blythe
Purchase Details
Closed on
Sep 5, 2000
Sold by
Beach Randy D and Beach Linda D
Bought by
Beach Randy D
Purchase Details
Closed on
Jan 15, 1976
Bought by
Rittger Herbert C and Rittger Susan C
Create a Home Valuation Report for This Property
The Home Valuation Report is an in-depth analysis detailing your home's value as well as a comparison with similar homes in the area
Home Values in the Area
Average Home Value in this Area
Purchase History
| Date | Buyer | Sale Price | Title Company |
|---|---|---|---|
| Rittger Herbert C | $100 | None Listed On Document | |
| Rittger Herbert C | $100 | None Listed On Document | |
| Rittger Herbert C | -- | Attorney | |
| Rittger Herbert C | -- | Attorney | |
| Rittger Susan C | $185,000 | -- | |
| Ethridge James S | $130,000 | -- | |
| Bailey Robert H | -- | -- | |
| Beach Randy D | -- | -- | |
| Rittger Herbert C | $14,600 | -- |
Source: Public Records
Tax History Compared to Growth
Tax History
| Year | Tax Paid | Tax Assessment Tax Assessment Total Assessment is a certain percentage of the fair market value that is determined by local assessors to be the total taxable value of land and additions on the property. | Land | Improvement |
|---|---|---|---|---|
| 2025 | $3,691 | $211,860 | $80,750 | $131,110 |
| 2024 | $3,691 | $207,751 | $80,750 | $127,001 |
| 2023 | $3,691 | $204,553 | $80,750 | $123,803 |
| 2022 | $3,543 | $198,495 | $80,750 | $117,745 |
| 2021 | $3,597 | $191,942 | $80,750 | $111,192 |
| 2020 | $3,552 | $189,061 | $90,250 | $98,811 |
| 2019 | $3,497 | $179,120 | $85,500 | $93,620 |
| 2018 | $3,580 | $180,189 | $80,750 | $99,439 |
| 2017 | $3,449 | $169,152 | $66,500 | $102,652 |
| 2016 | $3,348 | $152,088 | $0 | $0 |
| 2015 | $2,900 | $141,356 | $0 | $0 |
| 2014 | $2,534 | $107,107 | $0 | $0 |
Source: Public Records
Map
Nearby Homes
- 306 Washington St
- 306 Murray St
- 216 Murray St
- 218 Mary Ave
- 208 Mary Ave
- 200 Live Oak St
- 609 Downing St
- 314 Hillman St
- 508 Faulkner St
- 513 Ball St
- 306 Sheldon St
- 585 Washington St
- 305 Live Oak St
- 3491 Florida 44
- 132 Julia St
- 0 Julia St
- 334 Sheldon St
- 801 Canal St
- 200 S Riverside Dr Unit 2010
- 614 Washington St