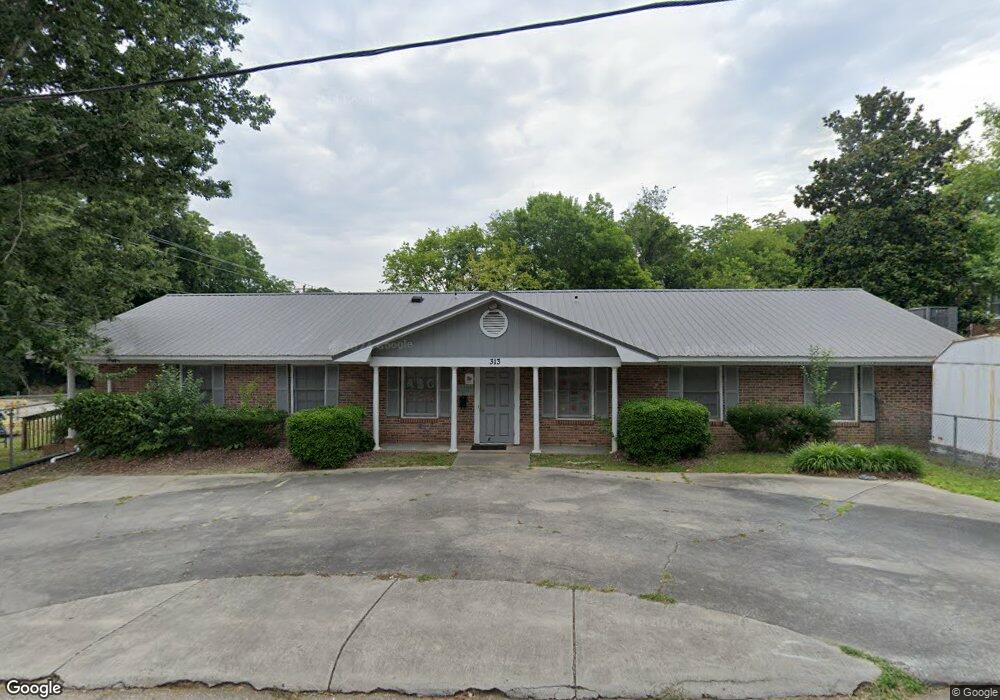
313 Moore St Lancaster, SC 29720
Estimated Value: $61,401
Studio
9
Baths
2,250
Sq Ft
$27/Sq Ft
Est. Value
About This Home
This home is located at 313 Moore St, Lancaster, SC 29720 and is currently estimated at $61,401, approximately $27 per square foot. 313 Moore St is a home located in Lancaster County with nearby schools including Brooklyn Springs Elementary School, Buford Middle School, and Lancaster High School.
Ownership History
Date
Name
Owned For
Owner Type
Purchase Details
Closed on
Sep 25, 2019
Sold by
Clyburn Belinda and Clyburn Belinda C
Bought by
Kennedy Tiffany S
Current Estimated Value
Purchase Details
Closed on
Sep 7, 2016
Sold by
Baird Josephine M Culp and Culp Steven
Bought by
Clyburn Belinda Carol
Purchase Details
Closed on
Dec 22, 2010
Sold by
Cooley Rachel
Bought by
Baird Josephine M Culp and Culp Josephine M
Purchase Details
Closed on
Apr 1, 2009
Sold by
Baird Josephine M Culp and Culp Josephine M
Bought by
Cooley Rachel
Home Financials for this Owner
Home Financials are based on the most recent Mortgage that was taken out on this home.
Original Mortgage
$102,000
Interest Rate
5.1%
Mortgage Type
Seller Take Back
Purchase Details
Closed on
Dec 11, 2008
Sold by
Disciples Llc
Bought by
Family Promise Of Lancaster County Inc
Create a Home Valuation Report for This Property
The Home Valuation Report is an in-depth analysis detailing your home's value as well as a comparison with similar homes in the area
Home Values in the Area
Average Home Value in this Area
Purchase History
| Date | Buyer | Sale Price | Title Company |
|---|---|---|---|
| Kennedy Tiffany S | -- | None Available | |
| Clyburn Belinda Carol | $35,000 | -- | |
| Baird Josephine M Culp | -- | -- | |
| Cooley Rachel | $115,000 | -- | |
| Family Promise Of Lancaster County Inc | -- | -- |
Source: Public Records
Mortgage History
| Date | Status | Borrower | Loan Amount |
|---|---|---|---|
| Previous Owner | Cooley Rachel | $102,000 |
Source: Public Records
Tax History
| Year | Tax Paid | Tax Assessment Tax Assessment Total Assessment is a certain percentage of the fair market value that is determined by local assessors to be the total taxable value of land and additions on the property. | Land | Improvement |
|---|---|---|---|---|
| 2024 | $1,885 | $4,314 | $300 | $4,014 |
| 2023 | $1,921 | $4,314 | $300 | $4,014 |
| 2022 | $1,924 | $4,314 | $300 | $4,014 |
| 2021 | $1,899 | $4,314 | $300 | $4,014 |
| 2020 | $1,291 | $2,964 | $300 | $2,664 |
| 2019 | $2,029 | $3,966 | $300 | $3,666 |
| 2018 | $1,292 | $3,966 | $300 | $3,666 |
| 2017 | $1,624 | $0 | $0 | $0 |
| 2016 | $2,968 | $0 | $0 | $0 |
| 2015 | $2,705 | $0 | $0 | $0 |
| 2014 | $2,705 | $0 | $0 | $0 |
| 2013 | $2,705 | $0 | $0 | $0 |
Source: Public Records
Map
Nearby Homes
Your Personal Tour Guide
Ask me questions while you tour the home.