O
Seller's Agent in 2018
OUTSIDE AGENT
OTHER
137 in this area
5,674 Total Sales
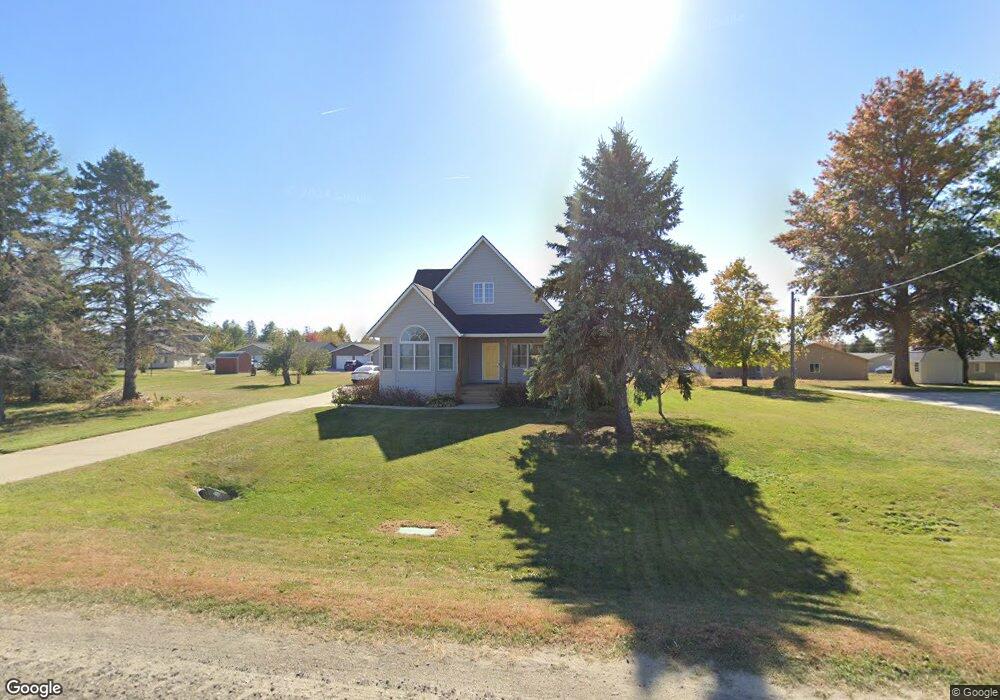
Estimated Value: $268,000 - $349,000
Outside of DMAAR MLS
| Date | Buyer | Sale Price | Title Company |
|---|---|---|---|
| Beshey David L | $180,000 | -- |
| Date | Status | Borrower | Loan Amount |
|---|---|---|---|
| Open | Beshey David L | $185,940 |
| Date | Event | Price | List to Sale | Price per Sq Ft | Prior Sale |
|---|---|---|---|---|---|
| 07/26/2018 07/26/18 | Sold | $180,000 | -2.2% | $106 / Sq Ft | |
| 07/26/2018 07/26/18 | Pending | -- | -- | -- | |
| 06/13/2018 06/13/18 | For Sale | $184,000 | +15.0% | $108 / Sq Ft | |
| 11/24/2015 11/24/15 | Sold | $160,000 | -5.9% | $94 / Sq Ft | View Prior Sale |
| 11/21/2015 11/21/15 | Pending | -- | -- | -- | |
| 08/31/2015 08/31/15 | For Sale | $170,000 | -- | $100 / Sq Ft |
| Year | Tax Paid | Tax Assessment Tax Assessment Total Assessment is a certain percentage of the fair market value that is determined by local assessors to be the total taxable value of land and additions on the property. | Land | Improvement |
|---|---|---|---|---|
| 2025 | $4,608 | $289,380 | $28,000 | $261,380 |
| 2024 | $4,608 | $261,930 | $28,000 | $233,930 |
| 2023 | $4,574 | $261,930 | $28,000 | $233,930 |
| 2022 | $4,212 | $221,750 | $28,000 | $193,750 |
| 2021 | $3,970 | $201,720 | $28,000 | $173,720 |
| 2020 | $3,970 | $181,160 | $23,790 | $157,370 |
| 2019 | $3,852 | $168,070 | $0 | $0 |
| 2018 | $3,852 | $168,070 | $0 | $0 |
| 2017 | $3,856 | $168,070 | $0 | $0 |
| 2016 | $3,856 | $184,930 | $0 | $0 |
| 2015 | $4,362 | $184,930 | $0 | $0 |
| 2014 | $4,196 | $184,930 | $0 | $0 |
O
Seller's Agent in 2018
OUTSIDE AGENT
OTHER
137 in this area
5,674 Total Sales

Buyer's Agent in 2018
Jeff Kinion
Realty ONE Group Impact
(515) 577-1941
2 in this area
159 Total Sales
Seller's Agent in 2015
Tom Butler
Keller Williams Realty GDM
(515) 639-8222
139 Total Sales
J
Buyer's Agent in 2015
Jason Morgan
First Choice Realty
(641) 521-6468
22 in this area
31 Total Sales
Source: Des Moines Area Association of REALTORS®
MLS Number: 563402
APN: 08-27-101-010
Disclaimer: Certain information contained herein is derived from information provided by parties other than Homes.com. All information provided is deemed reliable, but is not guaranteed to be accurate and should be independently verified.
![]() IDX information is provided exclusively for personal, non-commercial use, and may not be used for any purpose other than to identify prospective properties consumers may be interested in purchasing. Information is deemed reliable but not guaranteed.
IDX information is provided exclusively for personal, non-commercial use, and may not be used for any purpose other than to identify prospective properties consumers may be interested in purchasing. Information is deemed reliable but not guaranteed.