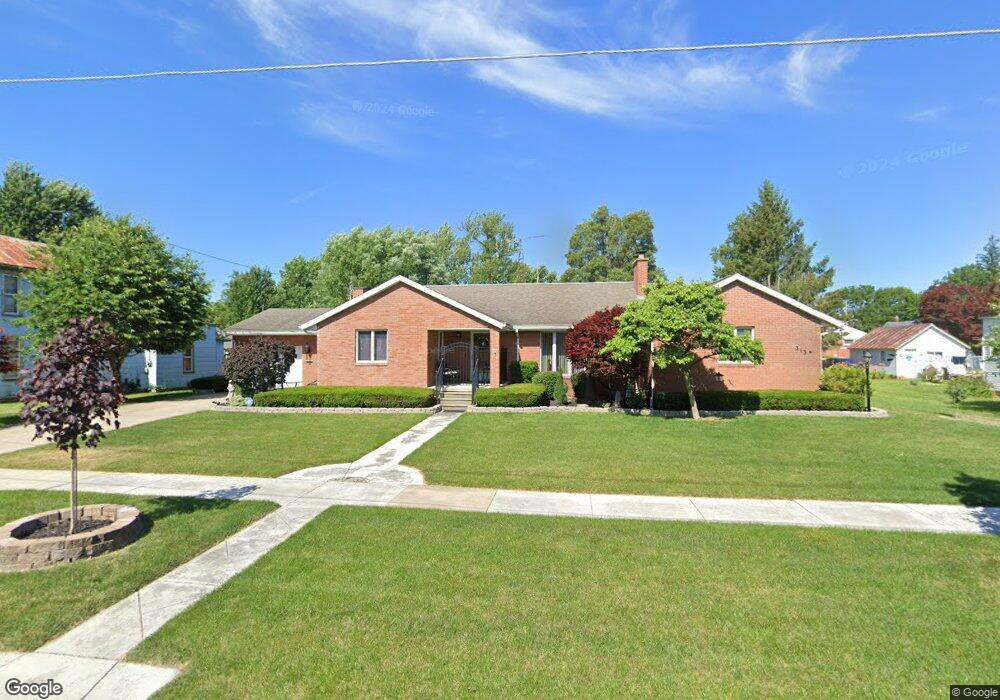
313 N 2nd St North Baltimore, OH 45872
Estimated Value: $168,000 - $224,000
3
Beds
3
Baths
2,496
Sq Ft
$80/Sq Ft
Est. Value
About This Home
This home is located at 313 N 2nd St, North Baltimore, OH 45872 and is currently estimated at $199,208, approximately $79 per square foot. 313 N 2nd St is a home located in Wood County with nearby schools including E.A. Powell Elementary School, North Baltimore Middle School, and North Baltimore High School.
Ownership History
Date
Name
Owned For
Owner Type
Purchase Details
Closed on
Oct 26, 2009
Sold by
Blair Leonard Paul
Bought by
Ebersole David G and Ebersole Susan E
Current Estimated Value
Home Financials for this Owner
Home Financials are based on the most recent Mortgage that was taken out on this home.
Original Mortgage
$81,200
Outstanding Balance
$53,210
Interest Rate
5.07%
Mortgage Type
New Conventional
Estimated Equity
$145,998
Purchase Details
Closed on
Jun 25, 2009
Sold by
Holy Family Catholic Church
Bought by
Blair Leonard Paul
Purchase Details
Closed on
Dec 29, 2008
Sold by
Gonyer Mary Angela and Gonyer Paul M
Bought by
Holy Family Catholic Church
Purchase Details
Closed on
Nov 19, 2008
Sold by
Estate Of Jeanne M Boney
Bought by
Gonyer Mary Angela and Holy Family Catholic Church
Purchase Details
Closed on
Jan 1, 1990
Bought by
Boney Mary G
Create a Home Valuation Report for This Property
The Home Valuation Report is an in-depth analysis detailing your home's value as well as a comparison with similar homes in the area
Home Values in the Area
Average Home Value in this Area
Purchase History
| Date | Buyer | Sale Price | Title Company |
|---|---|---|---|
| Ebersole David G | $99,000 | Attorney | |
| Blair Leonard Paul | -- | Attorney | |
| Holy Family Catholic Church | -- | Attorney | |
| Gonyer Mary Angela | -- | None Available | |
| Boney Mary G | -- | -- |
Source: Public Records
Mortgage History
| Date | Status | Borrower | Loan Amount |
|---|---|---|---|
| Open | Ebersole David G | $81,200 |
Source: Public Records
Tax History Compared to Growth
Tax History
| Year | Tax Paid | Tax Assessment Tax Assessment Total Assessment is a certain percentage of the fair market value that is determined by local assessors to be the total taxable value of land and additions on the property. | Land | Improvement |
|---|---|---|---|---|
| 2024 | $2,050 | $45,955 | $4,200 | $41,755 |
| 2023 | $2,050 | $45,960 | $4,200 | $41,760 |
| 2021 | $1,690 | $34,480 | $3,540 | $30,940 |
| 2020 | $1,812 | $34,480 | $3,540 | $30,940 |
| 2019 | $1,867 | $32,940 | $3,540 | $29,400 |
| 2018 | $1,866 | $32,940 | $3,540 | $29,400 |
| 2017 | $1,931 | $32,940 | $3,540 | $29,400 |
| 2016 | $1,679 | $30,600 | $3,540 | $27,060 |
| 2015 | $1,737 | $30,600 | $3,540 | $27,060 |
| 2014 | $1,743 | $30,600 | $3,540 | $27,060 |
| 2013 | $2,009 | $30,600 | $3,540 | $27,060 |
Source: Public Records
Map
Nearby Homes
- 233 & 235 N Main St
- 508 W Walnut St
- 323 W State St
- 227 E Broadway St
- 300 W Water St
- 112 N Beecher St
- 318 Belmont St
- 216 S Tarr St
- 209 Rudolph Rd
- 0 Eagleville Rd
- 128 Zihlman St
- Lot 112 Foley Run
- 12078 Eagleville Rd
- 201 Briar Hill Rd
- 215 Briar Hill Rd
- 930 E Broadway St
- 117 S Main St
- 11755 State Route 613
- 308 S Main St
- 10638 Township Road 109