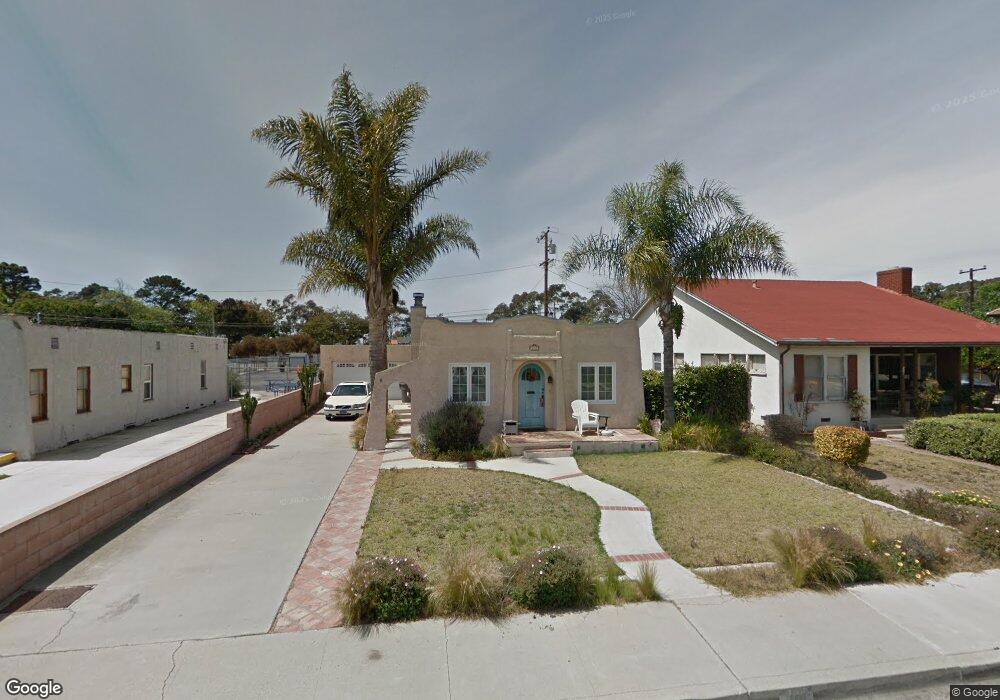
313 N 5th St Port Hueneme, CA 93041
Estimated Value: $657,000 - $696,000
2
Beds
2
Baths
1,234
Sq Ft
$552/Sq Ft
Est. Value
About This Home
This home is located at 313 N 5th St, Port Hueneme, CA 93041 and is currently estimated at $681,024, approximately $551 per square foot. 313 N 5th St is a home located in Ventura County with nearby schools including Hueneme Elementary and Hueneme High School.
Ownership History
Date
Name
Owned For
Owner Type
Purchase Details
Closed on
Mar 26, 2010
Sold by
Thacker Richard G
Bought by
Rodriguez Julieta I
Current Estimated Value
Home Financials for this Owner
Home Financials are based on the most recent Mortgage that was taken out on this home.
Original Mortgage
$211,500
Interest Rate
4.82%
Mortgage Type
New Conventional
Purchase Details
Closed on
May 20, 1999
Sold by
Anders Douglas J Rebecca S
Bought by
Thacker Richard G
Home Financials for this Owner
Home Financials are based on the most recent Mortgage that was taken out on this home.
Original Mortgage
$166,250
Interest Rate
7.4%
Purchase Details
Closed on
Dec 10, 1997
Sold by
Douglas Anders and Douglas J
Bought by
Anders Douglas J and Anders Rebecca S
Create a Home Valuation Report for This Property
The Home Valuation Report is an in-depth analysis detailing your home's value as well as a comparison with similar homes in the area
Home Values in the Area
Average Home Value in this Area
Purchase History
| Date | Buyer | Sale Price | Title Company |
|---|---|---|---|
| Rodriguez Julieta I | $235,000 | Ticor Title | |
| Thacker Richard G | $175,000 | First American Title Ins Co | |
| Anders Douglas J | -- | Old Republic Title Company |
Source: Public Records
Mortgage History
| Date | Status | Borrower | Loan Amount |
|---|---|---|---|
| Previous Owner | Rodriguez Julieta I | $211,500 | |
| Previous Owner | Thacker Richard G | $166,250 |
Source: Public Records
Tax History Compared to Growth
Tax History
| Year | Tax Paid | Tax Assessment Tax Assessment Total Assessment is a certain percentage of the fair market value that is determined by local assessors to be the total taxable value of land and additions on the property. | Land | Improvement |
|---|---|---|---|---|
| 2025 | $3,559 | $301,059 | $155,015 | $146,044 |
| 2024 | $3,559 | $295,156 | $151,975 | $143,181 |
| 2023 | $3,385 | $289,369 | $148,995 | $140,374 |
| 2022 | $3,290 | $283,696 | $146,074 | $137,622 |
| 2021 | $3,288 | $278,134 | $143,210 | $134,924 |
| 2020 | $3,248 | $275,285 | $141,743 | $133,542 |
| 2019 | $3,203 | $269,888 | $138,964 | $130,924 |
| 2018 | $3,098 | $264,597 | $136,240 | $128,357 |
| 2017 | $2,986 | $259,410 | $133,569 | $125,841 |
| 2016 | $2,898 | $254,324 | $130,950 | $123,374 |
| 2015 | $2,826 | $250,506 | $128,984 | $121,522 |
| 2014 | $2,812 | $245,601 | $126,458 | $119,143 |
Source: Public Records
Map
Nearby Homes
- 201 Village Rd
- 201 S Ventura Rd Unit 15
- 225 S Ventura Rd Unit 102
- 209 S Ventura Rd Unit 31
- 117 Ann Ave
- 408 Shoreview Dr
- 618 Island View Cir Unit 618
- 558 Terrace View Place
- 168 Courtyard Dr
- 181 Courtyard Dr
- 275 E Surfside Dr
- 218 E Surfside Dr
- 912 Maplewood Way
- 656 Sunfish Way
- 660 Sunfish Way
- 681 Ocean View Dr Unit 681A
- 705 Ocean View Dr Unit 705A
- 4811 S G St
- 916 Lighthouse Way
- 846 Bluewater Way