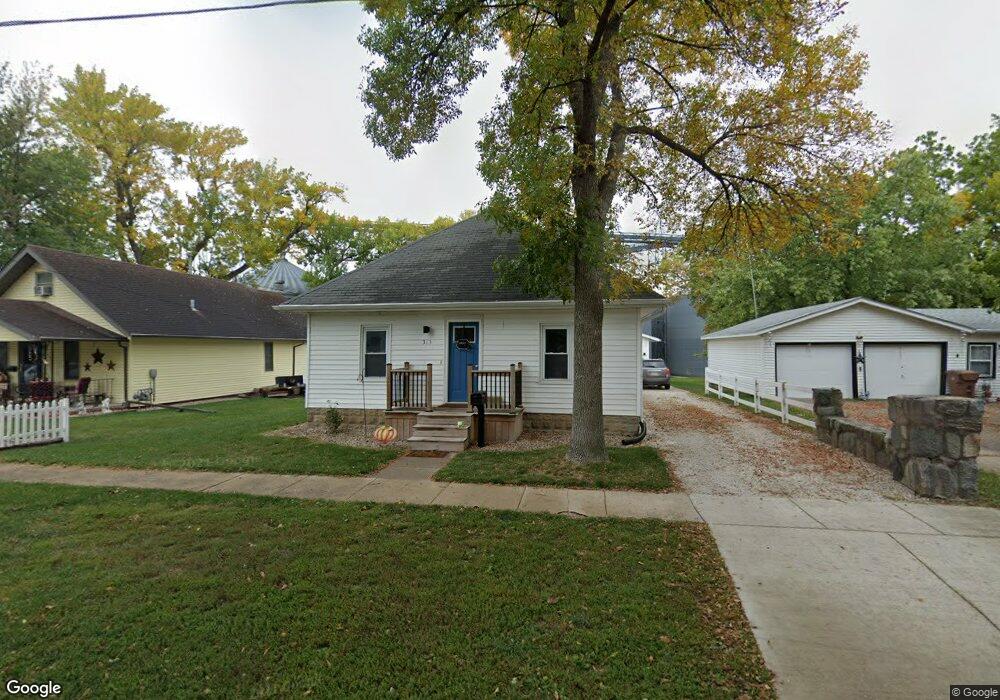
313 N Whitney St Carroll, IA 51401
Estimated Value: $97,000 - $119,699
2
Beds
1
Bath
1,064
Sq Ft
$101/Sq Ft
Est. Value
About This Home
This home is located at 313 N Whitney St, Carroll, IA 51401 and is currently estimated at $107,175, approximately $100 per square foot. 313 N Whitney St is a home with nearby schools including Fairview Elementary School, Adams Elementary School, and Carroll Middle School.
Ownership History
Date
Name
Owned For
Owner Type
Purchase Details
Closed on
May 3, 2023
Sold by
Lindner Orion S and Lindner Miranda C
Bought by
Newkirk Heather R
Current Estimated Value
Home Financials for this Owner
Home Financials are based on the most recent Mortgage that was taken out on this home.
Original Mortgage
$82,525
Outstanding Balance
$80,201
Interest Rate
6.32%
Mortgage Type
New Conventional
Estimated Equity
$26,974
Purchase Details
Closed on
Feb 25, 2022
Sold by
Anderson Sara J and Anderson Steven D
Bought by
Lindner Orion D
Home Financials for this Owner
Home Financials are based on the most recent Mortgage that was taken out on this home.
Original Mortgage
$66,679
Interest Rate
3.55%
Mortgage Type
New Conventional
Create a Home Valuation Report for This Property
The Home Valuation Report is an in-depth analysis detailing your home's value as well as a comparison with similar homes in the area
Home Values in the Area
Average Home Value in this Area
Purchase History
| Date | Buyer | Sale Price | Title Company |
|---|---|---|---|
| Newkirk Heather R | $80,000 | None Listed On Document | |
| Lindner Orion D | $65,000 | -- |
Source: Public Records
Mortgage History
| Date | Status | Borrower | Loan Amount |
|---|---|---|---|
| Open | Newkirk Heather R | $82,525 | |
| Previous Owner | Lindner Orion D | $66,679 |
Source: Public Records
Tax History Compared to Growth
Tax History
| Year | Tax Paid | Tax Assessment Tax Assessment Total Assessment is a certain percentage of the fair market value that is determined by local assessors to be the total taxable value of land and additions on the property. | Land | Improvement |
|---|---|---|---|---|
| 2025 | $692 | $71,710 | $12,360 | $59,350 |
| 2024 | $674 | $62,940 | $12,360 | $50,580 |
| 2023 | $1,075 | $62,940 | $12,360 | $50,580 |
| 2022 | $1,016 | $70,130 | $12,360 | $57,770 |
| 2021 | $1,016 | $70,130 | $12,360 | $57,770 |
| 2020 | $1,041 | $70,130 | $12,360 | $57,770 |
| 2019 | $1,088 | $70,130 | $12,360 | $57,770 |
| 2018 | $1,024 | $71,510 | $0 | $0 |
| 2017 | $858 | $71,509 | $9,256 | $62,253 |
| 2016 | $802 | $56,050 | $0 | $0 |
| 2015 | $802 | $52,470 | $0 | $0 |
| 2014 | $742 | $52,470 | $0 | $0 |
Source: Public Records
Map
Nearby Homes
- 332 N Crawford St
- 619 W 2nd St
- 0 Deer Creek Ln Unit 6302348
- 121 S West St
- 19383 U S 30
- 727 N Adams St
- 907 Salinger Ave
- 120 E 1st St Unit 2
- 0 E 10th St Unit 5423085
- 0 E 10th St Unit 6324630
- 0 E 10th St Unit 6319081
- 308 Prairie View Dr
- 807 N Court St
- 1015 N Adams St
- 804 N Clark St
- 407 Westridge Dr
- 926 N Court St
- 1102 N Main St
- 1108 N Main St
- 1608 Salinger Ave
- 317 N Whitney St
- 309 N Whitney St
- 325 N Whitney St
- 303 N Whitney St
- 314 N Whitney St
- 320 N Whitney St
- 526 W 3rd St
- 327 N Whitney St
- 326 N Whitney St
- 335 N Whitney St
- 518 W 3rd St
- 332 N Whitney St
- 615 W 4th St
- 525 W 3rd St
- 334 N Whitney St
- 336 N Whitney St
- 519 W 3rd St
- 602 W 4th St
- 604 W 4th St
- 309 N Crawford St