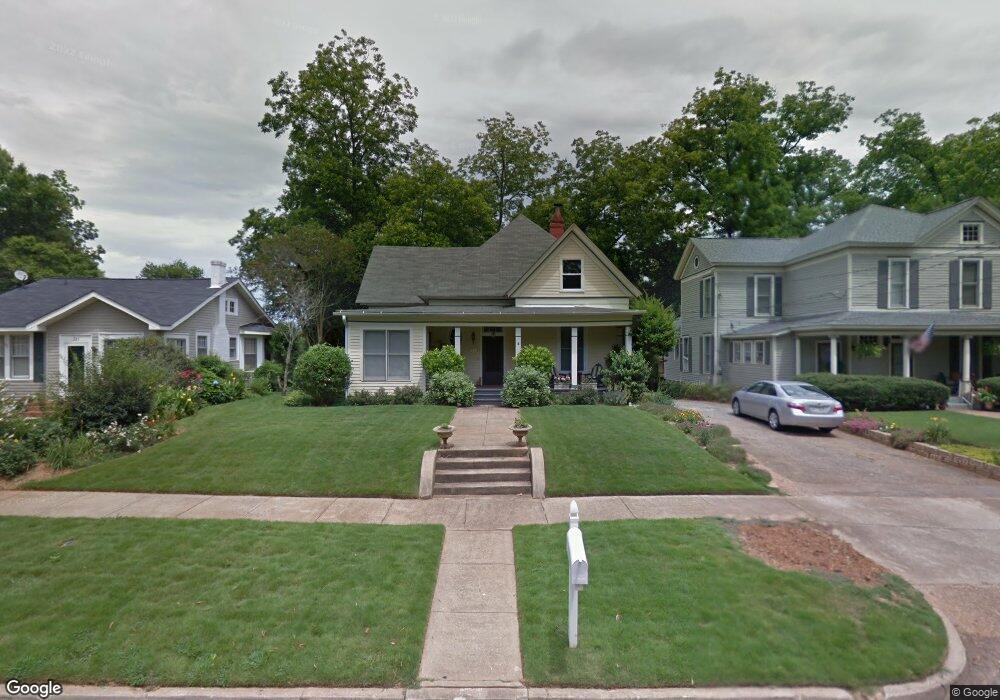
313 Park Ave Lagrange, GA 30240
Estimated Value: $203,000 - $269,000
2
Beds
2
Baths
1,896
Sq Ft
$123/Sq Ft
Est. Value
About This Home
This home is located at 313 Park Ave, Lagrange, GA 30240 and is currently estimated at $232,664, approximately $122 per square foot. 313 Park Ave is a home with nearby schools including Hollis Hand Elementary School, Ethel W. Kight Elementary School, and Franklin Forest Elementary School.
Ownership History
Date
Name
Owned For
Owner Type
Purchase Details
Closed on
Aug 31, 2007
Sold by
David Bobby Ray
Bought by
Lukken Amanda
Current Estimated Value
Home Financials for this Owner
Home Financials are based on the most recent Mortgage that was taken out on this home.
Original Mortgage
$121,050
Outstanding Balance
$75,779
Interest Rate
6.62%
Mortgage Type
New Conventional
Estimated Equity
$156,885
Purchase Details
Closed on
Jan 13, 2006
Sold by
Slay Jack Carl
Bought by
David Bobby Ray
Purchase Details
Closed on
May 27, 1993
Sold by
Robert Michael Lindsey
Bought by
Slay Jack C and Slay Lori K
Purchase Details
Closed on
May 30, 1989
Sold by
Lindsey
Bought by
Robert Michael Lindsey
Purchase Details
Closed on
Jan 1, 1985
Sold by
Spinks Calvin
Bought by
Lindsey
Purchase Details
Closed on
Jun 1, 1981
Sold by
Goodwin William B
Bought by
Spinks Calvin
Purchase Details
Closed on
Dec 19, 1970
Sold by
Goodwin Mary L
Bought by
Goodwin William B
Purchase Details
Closed on
Jan 1, 1961
Sold by
Woodyard Annette
Bought by
Goodwin Mary L
Create a Home Valuation Report for This Property
The Home Valuation Report is an in-depth analysis detailing your home's value as well as a comparison with similar homes in the area
Purchase History
| Date | Buyer | Sale Price | Title Company |
|---|---|---|---|
| Lukken Amanda | $134,500 | -- | |
| David Bobby Ray | $128,500 | -- | |
| Slay Jack C | $68,000 | -- | |
| Robert Michael Lindsey | -- | -- | |
| Lindsey | -- | -- | |
| Spinks Calvin | $33,000 | -- | |
| Goodwin William B | -- | -- | |
| Goodwin Mary L | -- | -- |
Source: Public Records
Mortgage History
| Date | Status | Borrower | Loan Amount |
|---|---|---|---|
| Open | Lukken Amanda | $121,050 |
Source: Public Records
Tax History
| Year | Tax Paid | Tax Assessment Tax Assessment Total Assessment is a certain percentage of the fair market value that is determined by local assessors to be the total taxable value of land and additions on the property. | Land | Improvement |
|---|---|---|---|---|
| 2025 | $1,786 | $75,520 | $10,000 | $65,520 |
| 2024 | $1,786 | $65,480 | $10,000 | $55,480 |
| 2023 | $1,776 | $65,120 | $10,000 | $55,120 |
| 2022 | $1,735 | $62,160 | $10,000 | $52,160 |
| 2021 | $1,666 | $55,240 | $10,000 | $45,240 |
| 2020 | $1,666 | $55,240 | $10,000 | $45,240 |
| 2019 | $992 | $32,880 | $5,200 | $27,680 |
| 2018 | $992 | $32,880 | $5,200 | $27,680 |
| 2017 | $992 | $32,880 | $5,200 | $27,680 |
| 2016 | $978 | $32,432 | $5,200 | $27,232 |
| 2015 | $995 | $32,928 | $5,696 | $27,232 |
| 2014 | $953 | $31,494 | $5,696 | $25,799 |
| 2013 | -- | $33,400 | $5,668 | $27,732 |
Source: Public Records
Map
Nearby Homes
- 208 Boulevard
- 119 College Ave
- 304 Boulevard
- 112 Boulevard
- 416 Park Ave
- 405 W Broome St Unit 2
- 405 W Broome St Unit 3
- 405 W Broome St Unit 4
- 405 W Broome St Unit 1
- 405 W Broome St Unit 5
- 207 Wilkes St
- 600 Park Ave
- 598 Edmondson Ave
- 505 S Lewis St
- 217 Jefferson St
- 206 Broad St
- 509 S Lewis St
- 203 Waverly Way
- 206 Peachtree St
- 200 Peachtree St
Your Personal Tour Guide
Ask me questions while you tour the home.